


 , Chang-Sheng Ma 1,*
1 Department of Echocardiography Cardiology, The First Affiliated Hospital of Soochow University, 215031 Suzhou, Jiangsu, China
2 Department of Cardiology, The First Affiliated Hospital of Soochow University, 215031 Suzhou, Jiangsu, China
3 Department of Medicine, Jiangsu University, 212013 Zhenjiang, Jiangsu, China
†These authors contributed equally.
Abstract
Background: Atrial fibrillation (AF) can lead to a decline in left
atrial appendage (LAA) function, potentially increasing the likelihood of LAA
thrombus (LAAT) and spontaneous echo contrast (SEC). Measuring LAA flow velocity
through transesophageal echocardiography (TEE) is currently the primary method
for evaluating LAA function. This study aims to explore the potential correlation
between anterior mitral annular plane systolic excursion (aMAPSE) and LAA stasis
in patients with non-valvular atrial fibrillation (NVAF). Methods: A
total of 465 patients with NVAF were enrolled between October 2018 and November
2021. Transthoracic echocardiography (TTE) and TEE were performed before
scheduled electrical cardioversion. Propensity score matching
(PSM) was used to balance confounders between the groups with and without
LAAT/dense SEC. Results: Patients in the LAAT/dense SEC group showed
increased left atrial (LA) diameter, LAA area, alongside reduced left ventricular
ejection fraction (LVEF), LAA velocity, conjunction thickening ratio, aMAPSE, and
LAA fraction area change (FAC) compared to those in the non-LAAT/dense SEC group.
Multivariate logistic regression analysis identified aMAPSE and LAA FAC as
independent predictors for LAAT/dense SEC. Specifically, an aMAPSE of
Keywords
- transesophageal echocardiography
- atrial fibrillation
- left atrial appendage
- spontaneous echocardiographic contrast
- left atrial appendage function
Non-valvular atrial fibrillation (NVAF) significantly increases the risk of stroke or systemic embolism [1]. In NVAF patients, more than 90% of thrombi originate within the left atrial (LA) appendage (LAA) [2]. Both LAA thrombus (LAAT) and LAA spontaneous echocardiographic contrast (SEC) are correlated with an increased risk of thrombus formation and thromboembolic events [3, 4, 5, 6]. Presently, two-dimensional (2D) transesophageal echocardiography (TEE) is the principal method for diagnosing and excluding the presence of LAAT and LAA SEC [7].
As atrial fibrillation (AF) progresses, LAA function tends to deteriorate, heightening the risk of LAAT and LAA SEC [8]. Notably, LAA flow velocity serves as an indirect measurement for evaluating LAA function and is widely utilized in clinical practice. Specifically, an LAA emptying velocity (LAA-EV) of 40 cm/s or less is associated with an increased risk of thrombus formation within the LAA, potentially leading to embolic events [9]. Moreover, velocities of 20 cm/s or below frequently indicate the presence of SEC in the LA/LAA [5, 10, 11, 12]. Besides LAA flow velocity, the LAA emptying fraction (LAAEF) measured by TEE has been shown to correlate with LAAT in NVAF patients with a low CHADS2 score [13].
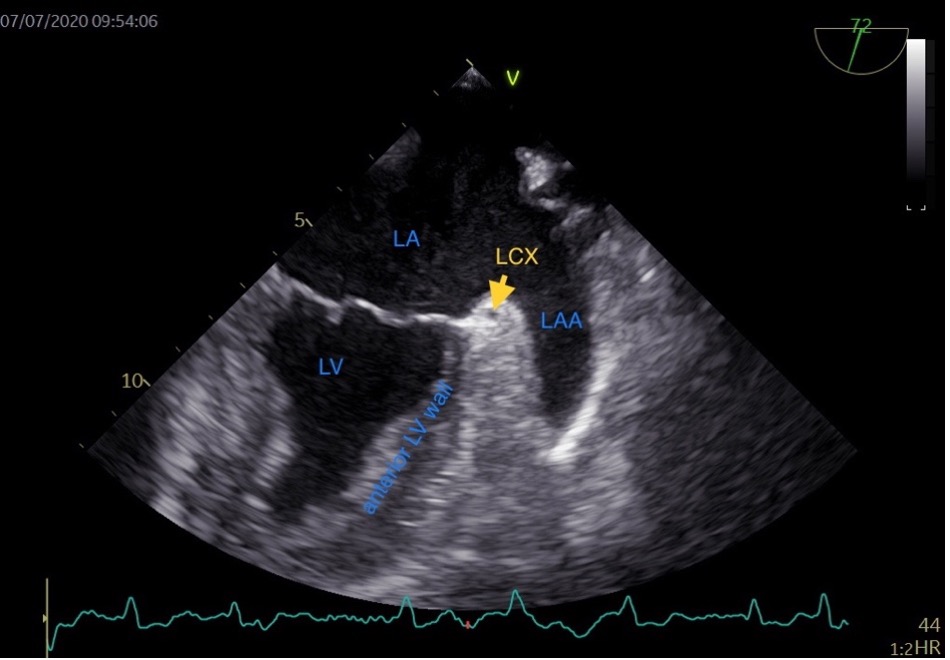
Typically, the LAA extends between the anterior and lateral walls of the LA, with its tip directed anterosuperiorly. This orientation causes it to overlay the left side of the right ventricular outflow tract, the pulmonary trunk, or to be in proximity to the main branch of the left coronary or the left circumflex artery (LCX). The LAA’s somewhat flattened structure results in its underside often covering the anterior and lateral walls of the left ventricle, while its topside is positioned under the fibrous pericardium [14]. In the TEE view of the LAA, the base of the left ventricle (LV) anterior wall is adjacent to the LAA (Fig. 1). The LAA compresses during LV diastole and stretches during LV systole. We speculate that the structure and function of the base of the LV anterior wall may influence LAA function. Consequently, we hypothesize that the anterior mitral annular plane systolic excursion (aMAPSE) can be utilized to assess LAA function. Additionally, the conjunction of LA and LAA is composed of LAA wall and fibrous pericardium, which vary in thickness with the systole and diastole phases of the LAA. We speculate that the LAA conjunction thickness ratio may reflect LAA function and correlate with LAA stasis. Given that the base of the LV wall compresses and stretches the LAA, we included the base of LV wall in measuring the LAA conjunction thickness.
 Fig. 1.
Transesophageal echocardiographic view of the left atrial appendage. LA, left atrium; LV, left ventricle; LCX, left circumflex artery; LAA, left atrial appendage; HR, heart rate.
The aim of this study was to investigate the correlation between LAA functional parameters and the presence of LAAT or dense SEC in patients with NVAF. Further, we compare the diagnostic value of aMAPSE with standard LAA functional parameters for detecting LAAT and dense SEC.
The study was approved by the institutional enrolling board of the first
affiliated hospital of Soochow university. Between October 2018 and November
2021, we prospectively studied 465 patients with NVAF after providing informed
written and verbal consent, 2D-TEE examination was performed for them to exclude
the presence of LAA SEC or thrombus before radiofrequency ablation. This study
excluded patients who met any of the following criteria: moderate to severe
valvular disease, hypertrophic cardiomyopathy, unsuccessful TEE procedures, and
instances with images that did not meet quality standards. Collected clinical
data encompassed demographic information, current medication regimens, and
previous medical history. The CHA
We performed TTE using the General Electric Vivid E95 device (GE Vingmed Ultrasound AS, Horten, Norway) and a sector array M5Sc (2.5–3.5 MHz) transducer (GE Vingmed Ultrasound AS, Horten, Norway). Images were acquired to measure left atrial diameter, left ventricular end-diastolic diameter (LVEDd), left ventricular ejection fraction (LVEF), E/e’ and systolic pulmonary arterial pressure (sPAP). The LA diameter was measured in the parasternal long-axis view at the ventricular end-systole. The LVEF was measured using Simpson’s method, which was used as a standard index of global LV systolic function. In addition, E/e’ was the ratio of early diastolic mitral inflow to mitral annular tissue velocities (the average of septal e’ and lateral e’). All echocardiographic measurements for AF patients used in the analysis were averaged from 3 heart beats.
The TEE procedures were performed consistently by a single operator, utilizing a GE Vivid E95 apparatus (GE Vingmed Ultrasound AS, Horten, Norway) equipped with a multiplane 6VT (3.0-8.0 MHz) transducer. Optimal visualization of the LAA was achieved through the mid-esophageal approach, angling the probe (usually between 45° and 90°) to maximize the length from apex to orifice. The imaging frame rate was maintained between 60 and 90 frames per second. Typically, five cardiac cycles were analyzed for both 2D imaging and pulsed wave (PW) Doppler studies. The PW-Doppler was employed to measure LAA flow at the orifice, with appropriate adjustments made to gain and filter settings. Both LAA-EV and LAA filling velocity (LAA-FV) were recorded (Fig. 2A). The LAA fractional area change (LAA FAC) was determined using the formula: (maximum LAA area – minimum LAA area)/maximum LAA area (Fig. 2B). The measurement of the LAA ostium was taken from the circumflex artery to a superior point situated 1 to 2 cm within the left lateral ridge, while the depth of the LAA is gauged from this line to the LAA’s apex [16]. The aMAPSE was measured between end-diastole and peak systole using M-mode in the direction of anterior left ventricle longitudinal extension, which was assessed from the apical approach (Fig. 2C). Conjunction thickness was measured from 0–3 mm beneath LCX and perpendicular to anterior wall of left ventricle. The conjunction thickening ratio was defined as conjunction thickening gradient divided by maximum thickness of LAA conjunction (Fig. 2D). In cases of AF, the mean values from three cardiac cycles were evaluated.
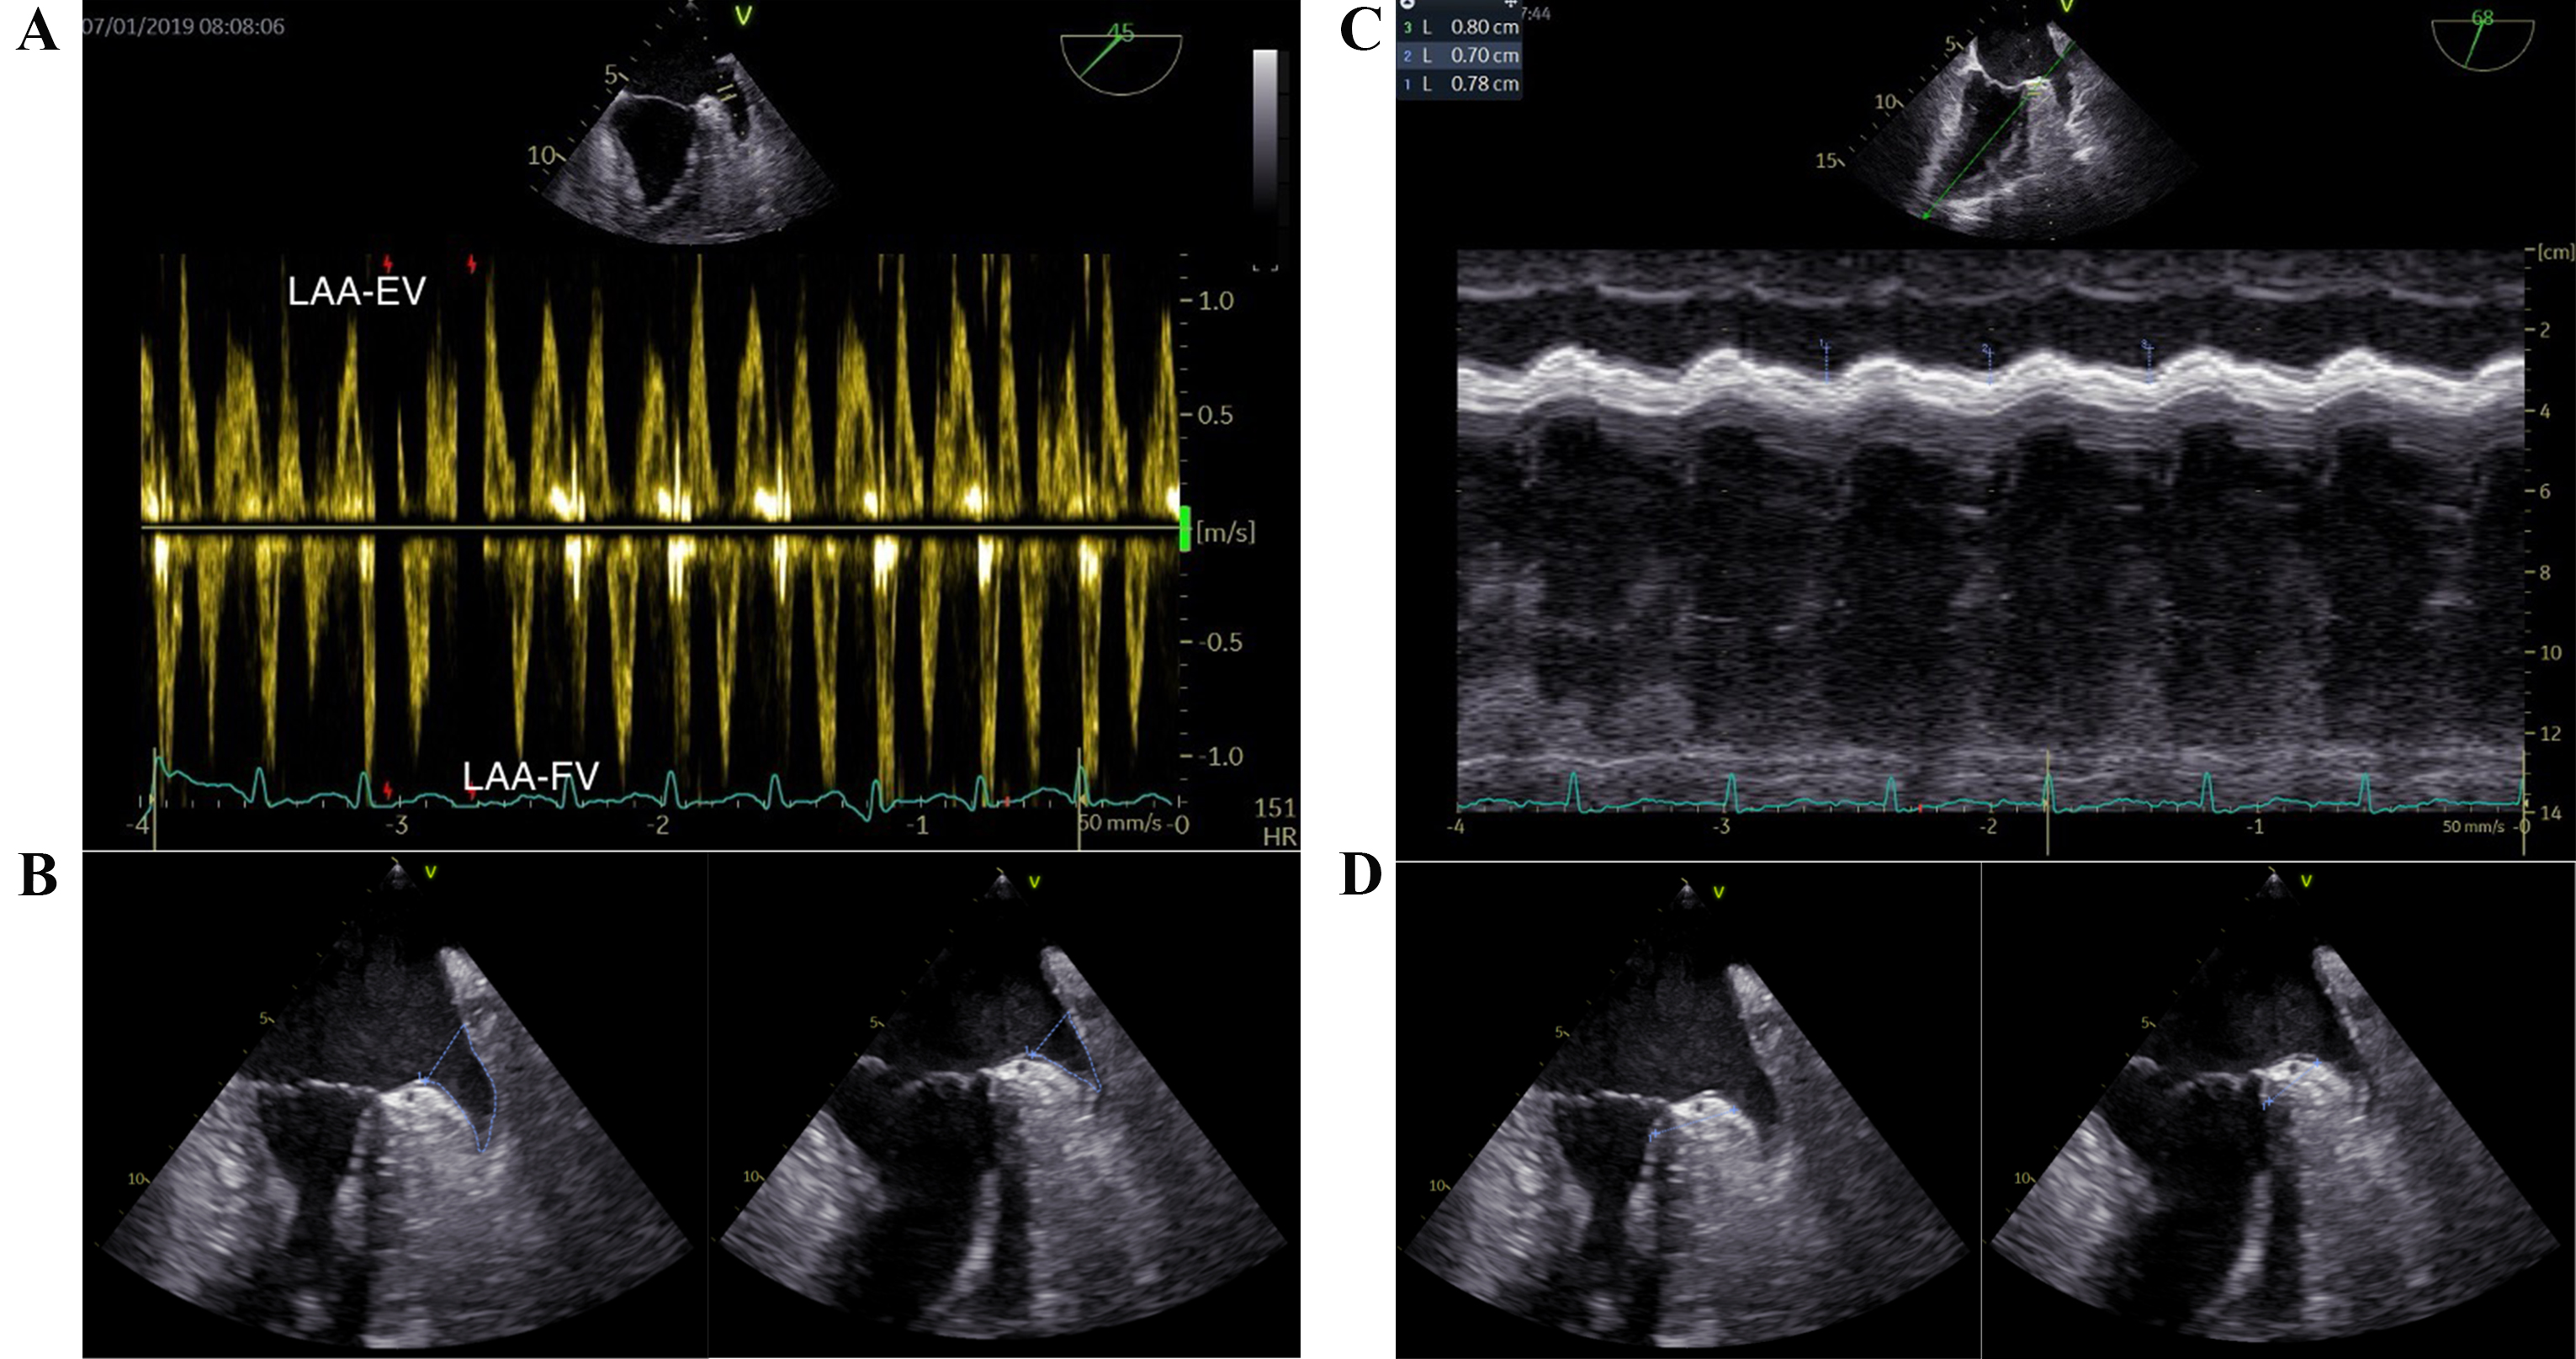 Fig. 2.
Key transesophageal echocardiographic parameters in the LAA function assessment. (A) LAA-EV and LAA-FV. (B) LAA fraction area change (maximum LAA area and minimum LAA area). (C) aMAPSE. (D) LAA conjunction thickening ratio (maximum LAA conjunction thickness and minimum LAA conjunction thickness). LAA, left atrial appendage; LAA-EV, left atrial appendage emptying velocity; LAA-FV, left atrial appendage filling velocity; aMAPSE, anterior mitral annular plane systolic excursion; HR, heart rate.
SEC was identified by the presence of dynamic, swirling, smoke-like echoes in the LAA cavity [17]. The severity of SEC was classified into five grades using predefined criteria: none (0), mild (1+), moderate (2+), moderate to severe (3+), and severe (4+) [18]. LAAT was defined from various imaging angles as a clearly delineated, solid echo density that stood out acoustically from the surrounding endocardium and pectinate muscles, exhibiting less heterogeneity and dynamism compared to sludge [19, 20].
Analyses were performed using the STATA 17.0 (StataCorp LP, College Station, TX,
USA). In the current study, patients were categorized into two groups: those with
LAAT/dense SEC and those without (non-LAAT/dense SEC). Propensity score matching
(PSM) was used to adjust for confounders between the two groups. The variables
included for matching were age, gender, body surface area (BSA), persistent AF,
prior embolic events including transient ischemic attack (TIA) or ischemic
stroke, hypertension, diabetes, congestive heart failure, vascular disease, and
use of anticoagulants. We matched the two groups in a 1:1 ratio with a caliper
width of 0.2. Normally distributed continuous variables were presented as mean
Among the 465 study subjects, LAAT/dense SEC was identified by TEE in 107 (23.01%). Before propensity score matching, we detected differences in several baseline variables between the two groups. After applying propensity score matching, 56 patients were selected for each of the LAAT/dense SEC and non-LAAT/dense SEC groups. Post-matching analysis revealed no significant differences in demographic and clinical characteristics between the groups (Table 1).
| Variables | Before matching | After matching | |||||
| Non-LAAT/dense SEC (n = 358) | LAAT/dense SEC (n = 107) | p | Non-LAAT/dense SEC (n = 56) | LAAT/dense SEC (n = 56) | p | ||
| Age (y) | 65.00 (58.00, 69.00) | 67.00 (63.00, 72.00) | 67.00 (62.00, 72.00) | 67.50 (62.00, 71.00) | 0.760 | ||
| Gender | 0.007 | 0.570 | |||||
| Female | 135 (37.71%) | 56 (52.34%) | 28 (50.00%) | 25 (44.64%) | |||
| Male | 223 (62.29%) | 51 (47.66%) | 28 (50.00%) | 31 (55.36%) | |||
| BSA (m |
1.87 (0.18) | 1.82 (0.19) | 0.006 | 1.84 (0.17) | 1.84 (0.19) | 0.930 | |
| Persistent AF | 156 (43.58%) | 99 (92.52%) | 50 (89.29%) | 50 (89.29%) | 1.000 | ||
| Previous embolic events, TIA, or ischemic stroke | 32 (9.04%) | 10 (9.43%) | 0.900 | 5 (8.93%) | 5 (8.93%) | 1.000 | |
| Hypertension | 204 (57.46%) | 70 (66.04%) | 0.870 | 36 (64.29%) | 33 (58.93%) | 0.560 | |
| Diabetes | 37 (10.42%) | 25 (23.81%) | 7 (12.50%) | 9 (16.07%) | 0.590 | ||
| Congestive heart failure | 19 (7.09%) | 14 (16.87%) | 0.008 | 5 (8.93%) | 7 (12.50%) | 0.540 | |
| Vascular disease | 26 (7.34%) | 9 (8.49%) | 0.800 | 3 (5.36%) | 2 (3.57%) | 0.650 | |
| Anticoagulants | 185 (51.82%) | 68 (64.15%) | 0.025 | 34 (60.71%) | 36 (64.29%) | 0.700 | |
| CHA |
2.00 (1.00, 3.00) | 3.00 (2.00, 4.00) | 2.00 (1.00, 3.00) | 2.00 (2.00, 3.00) | 0.850 | ||
| Platelet (10 |
178.00 (146.00, 216.00) | 177.50 (140.50, 212.00) | 0.490 | 181.00 (143.00, 216.00) | 174.50 (137.00, 210.00) | 0.510 | |
| WBC (10 |
5.56 (4.68, 6.68) | 5.92 (4.54, 6.98) | 0.260 | 5.38 (4.63, 6.90) | 5.92 (4.70, 7.15) | 0.550 | |
| Hemoglobin (g/L) | 140.00 (128.00, 150.00) | 139.00 (127.00, 152.50) | 0.810 | 136.00 (130.00, 153.00) | 139.00 (129.00, 153.00) | 0.990 | |
| NT-proBNP (pg/mL) | 302.00 (123.90, 631.20) | 1112.00 (677.50, 1922.00) | 805.70 (344.80, 1474.00) | 1125.00 (734.60, 1522.00) | 0.150 | ||
LAAT, left atrial appendage thrombus; SEC, spontaneous echo contrast; AF, atrial fibrillation; BSA, body surface area; TIA, transient ischemic attack; WBC, white blood cell; NT-proBNP, N-terminal pro b-type natriuretic peptide.
After PSM, the LAAT/dense SEC group exhibited several notable echocardiographic differences. This group had an increased LA diameter, maximum and minimum LAA areas (LAAmax and LAAmin), but showed reduced LVEF, LAA-EV, LAA-FV, conjunction thickening ratio, aMAPSE, and LAA FAC compared to the non-LAAT/dense SEC group. There were no significant differences in LVEDd, E/e’ ratio, sPAP, LAA ostial diameter, LAA depth, or the number of LAA lobes (Table 2).
| Variables | Before matching | After matching | |||||
| Non-LAAT/dense SEC (n = 358) | LAAT/dense SEC (n = 107) | p | Non-LAAT/dense SEC (n = 56) | LAAT/dense SEC (n = 56) | p | ||
| Standard echocardiographic parameters | |||||||
| LA diameter (mm) | 43.00 (40.00, 46.00) | 48.00 (44.00, 53.00) | 45.00 (41.50, 47.50) | 48.00 (44.00, 52.00) | |||
| LVEDd (mm) | 49.00 (46.00, 52.00) | 50.00 (47.00, 55.00) | 0.003 | 49.00 (46.00, 52.00) | 50.00 (46.00, 56.00) | 0.093 | |
| LVEF (%) | 61.00 (58.00, 65.00) | 57.00 (46.00, 61.00) | 60.00 (56.00, 63.50) | 56.00 (42.00, 61.00) | |||
| E/e’ | 9.06 (7.20, 11.40) | 11.40 (8.40, 14.10) | 10.30 (8.10, 12.25) | 11.40 (8.60, 14.10) | 0.120 | ||
| sPAP (mmHg) | 26.00 (22.00, 29.00) | 28.00 (24.00, 33.00) | 26.00 (23.00, 32.00) | 27.00 (23.00, 32.00) | 0.710 | ||
| LAA structure parameters | |||||||
| Number of LAA lobes | 3.15 (1.46) | 3.61 (1.35) | 0.004 | 3.40 (1.51) | 3.30 (1.27) | 0.710 | |
| LAAmax (cm |
2.86 (2.22, 3.64) | 3.55 (2.66, 4.71) | 292.72 (221.41, 356.30) | 392.37 (275.60, 481.05) | 0.001 | ||
| LAAmin (cm |
0.99 (0.34, 1.98) | 2.86 (2.06, 3.70) | 150.51 (91.39, 245.46) | 292.62 (215.59, 371.24) | |||
| LAA ostial diameter (mm) | 19.00 (16.00, 21.00) | 21.00 (19.00, 23.00) | 19.00 (16.00, 22.00) | 21.00 (18.00, 23.00) | 0.067 | ||
| LAA depth (mm) | 26.60 (5.93) | 29.59 (6.32) | 26.98 (6.82) | 29.02 (6.68) | 0.120 | ||
| LAA functional parameters | |||||||
| LAA-EV (cm/s) | 45.00 (32.00, 67.00) | 21.50 (17.00, 28.00) | 32.50 (25.00, 42.00) | 22.00 (18.00, 28.00) | |||
| LAA-FV (cm/s) | 48.00 (34.00, 64.00) | 25.00 (20.00, 35.00) | 39.00 (33.00, 52.00) | 25.00 (20.00, 38.00) | |||
| Conjunction thickening ratio (%) | 22.89 (16.66, 29.19) | 11.70 (7.63, 15.51) | 16.38 (12.14, 21.26) | 11.85 (8.93, 14.43) | |||
| aMAPSE (mm) | 10.83 (8.00, 13.87) | 5.09 (4.34, 6.45) | 8.03 (6.85, 10.25) | 5.75 (4.55, 6.59) | |||
| LAA FAC (%) | 61.86 (26.69) | 21.78 (13.23) | 45.68 (23.97) | 22.41 (12.81) | |||
LAAT, left atrial appendage thrombus; SEC, spontaneous echo contrast; LA, left atrial; LVEDd, left ventricular end-diastolic diameter; LVEF, left ventricular ejection fraction; sPAP, systolic pulmonary arterial pressure; LAA, left atrial appendage; EV, emptying velocity; FV, filling velocity; LAAmax, maximum left atrial appendage area; LAAmin, minimum left atrial appendage area; aMAPSE, anterior mitral annular plane systolic excursion; FAC, fraction area change.
Multivariate analysis in the matched cohort revealed that aMAPSE and LAA FAC were independent predictors of LAAT/dense SEC (Table 3). Both LAA FAC and aMAPSE demonstrated a higher diagnostic accuracy in predicting LAAT/dense SEC when compared to LAA-EV and LAA-FV. The diagnostic performance of LAA FAC reached an area under the curve (AUC) of 0.80, with a cutoff value of 29.65%, a sensitivity of 0.70, and a specificity of 0.84. For aMAPSE, the AUC was 0.81, with a cutoff value of 6.76 mm, a sensitivity of 0.81, and a specificity of 0.80 (Fig. 3, Table 4).
| Variables | Univariate analysis | Multivariate analysis | ||
| OR (95% CI) | p | OR (95% CI) | p | |
| Gender | 1.24 (0.59, 2.61) | 0.570 | ||
| Age | 1.00 (0.95, 1.04) | 0.850 | ||
| BSA | 1.10 (0.14, 8.49) | 0.926 | ||
| Persistent AF | 1.00 (0.30, 3.31) | 1.000 | ||
| Diabetes | 1.34 (0.46, 3.89) | 0.590 | ||
| Congestive heart failure | 1.46 (0.43, 4.90) | 0.543 | ||
| CHA |
0.94 (0.71, 1.24) | 0.670 | ||
| Anticoagulants | 1.16 (0.54, 2.50) | 0.696 | ||
| NT-proBNP | 1.00 (1.00, 1.00) | 0.181 | ||
| LA diameter | 1.17 (1.07, 1.27) | |||
| LVEDd | 1.09 (1.02, 1.16) | 0.017 | ||
| LVEF | 0.93 (0.89, 0.97) | 0.001 | ||
| E/e’ | 1.09 (0.98, 1.21) | 0.103 | ||
| sPAP | 1.00 (0.96, 1.05) | 0.891 | ||
| LAA lobes | 0.95 (0.72, 1.25) | 0.708 | ||
| LAAmax | 1.00 (1.00, 1.01) | 0.002 | ||
| LAA ostium | 1.08 (0.99, 1.19) | 0.093 | ||
| LAA depth | 1.05 (0.99, 1.11) | 0.118 | ||
| LAA-EV | 0.92 (0.88, 0.96) | |||
| LAA-FV | 0.94 (0.91, 0.97) | |||
| Conjunction thickening ratio | 0.90 (0.84, 0.96) | 0.001 | ||
| aMAPSE | 0.47 (0.35, 0.65) | 0.36 (0.20, 0.66) | 0.001 | |
| LAA FAC | 0.93 (0.91, 0.96) | 0.94 (0.90, 0.99) | 0.023 | |
LAAT, left atrial appendage thrombus; SEC, spontaneous echo contrast; BSA, body surface area; AF, atrial fibrillation; NT-proBNP, N-terminal pro b-type natriuretic peptide; LA, left atrium; LVEDd, left ventricular end-diastolic diameter; LVEF, left ventricular ejection fraction; sPAP, systolic pulmonary arterial pressure; LAA, left atrial appendage; EV, emptying velocity; FV, filling velocity; LAAmax, maximum left atrial appendage area; aMAPSE, anterior mitral annular plane systolic excursion; FAC, fraction area change; OR, odds ratio.
| Cut-off value | Sensitivity | Specificity | AUC | p | |
| LAA-EV | 33 cm/s | 0.80 | 0.65 | 0.73 | 0.046 |
| LAA-FV | 30 cm/s | 0.83 | 0.65 | 0.74 | 0.046 |
| aMAPSE | 6.76 mm | 0.81 | 0.80 | 0.81 | 0.037 |
| LAA-FAC | 29.65% | 0.70 | 0.84 | 0.80 | 0.042 |
AUC, area under the curve; LAA, left atrial appendage; EV, emptying velocity; FV, filling velocity; aMAPSE, anterior mitral annular plane systolic excursion; FAC, fraction area change.
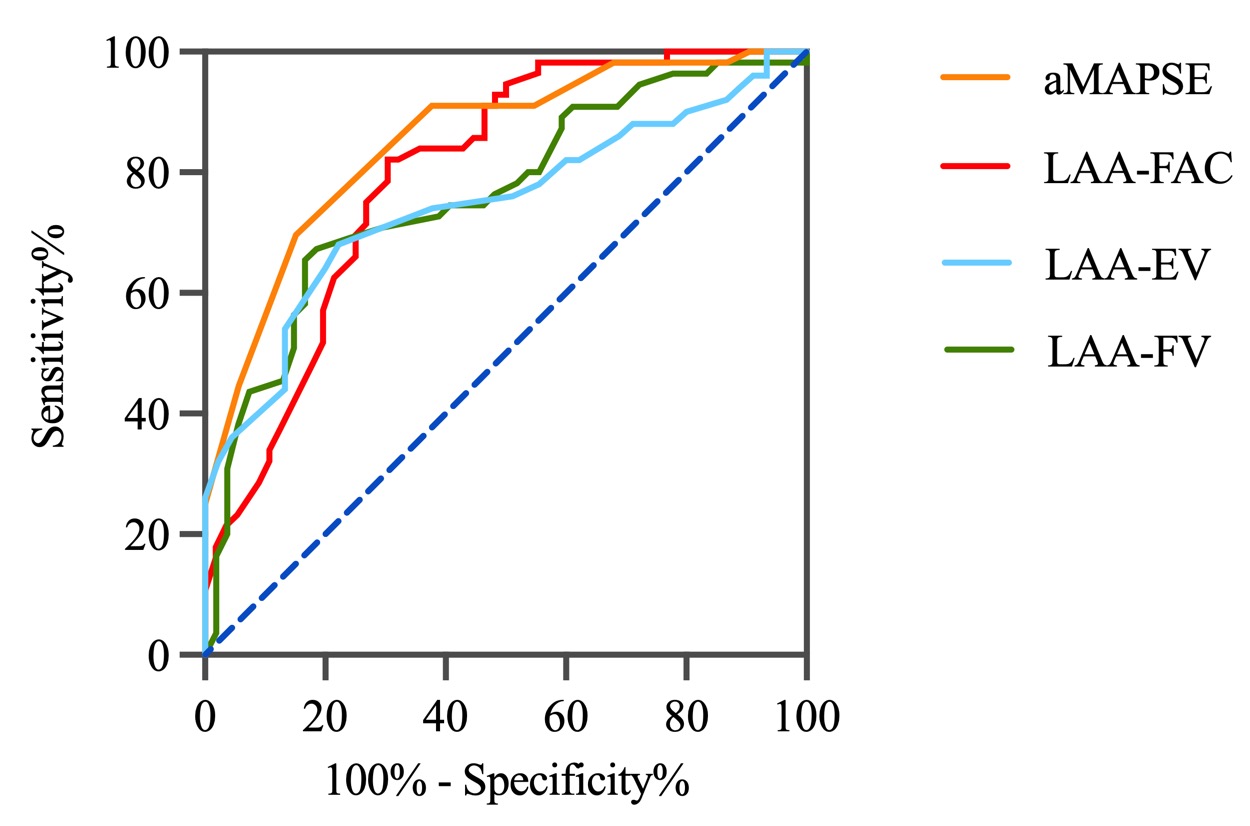 Fig. 3.
Diagnostic accuracy of LAA functional parameters. This figure illustrates the diagnostic performance of various LAA functional parameters in predicting LAAT and SEC. LAA, left atrial appendage; aMAPSE, anterior mitral annular plane systolic excursion; LAAT, left atrial appendage thrombus; SEC, spontaneous echo contrast; FAC, fraction area change; EV, emptying velocity; FV, filling velocity.
We found the normal aMAPSE group had a lower median age compared to the reduced
aMAPSE group. Patients in the reduced aMAPSE group were more likely to have
persistent AF, along with higher rates of diabetes and congestive heart failure.
Additionally, these patients exhibited significantly elevated CHA
| Variables | Normal aMPASE (n = 337) | Reduced aMAPSE (n = 128) | p | |
| Age (y) | 64.50 (57.00, 69.00) | 67.00 (62.50, 71.50) | ||
| Gender | 0.180 | |||
| Female | 132 (39.17%) | 59 (46.09%) | ||
| Male | 205 (60.83%) | 69 (53.91%) | ||
| BSA (m |
1.87 (0.19) | 1.85 (0.18) | 0.360 | |
| Persistent AF | 137 (40.65%) | 118 (92.19%) | ||
| Previous embolic events, TIA, or ischemic stroke | 30 (9.01%) | 12 (9.45%) | 0.880 | |
| Hypertension | 190 (56.89%) | 84 (66.14%) | 0.071 | |
| Diabetes | 36 (10.81%) | 26 (20.47%) | 0.007 | |
| Congestive heart failure | 15 (6.00%) | 18 (17.82%) | ||
| Vascular disease | 25 (7.49%) | 10 (7.94%) | 0.820 | |
| Anticoagulants | 176 (52.38%) | 77 (60.63%) | 0.110 | |
| CHA |
2.00 (1.00, 3.00) | 3.00 (2.00, 4.00) | ||
| Platelet (10 |
178.00 (143.00, 217.50) | 179.00 (143.00, 209.00) | 0.440 | |
| WBC (10 |
5.58 (4.68, 6.75) | 5.85 (4.60, 6.71) | 0.420 | |
| Hemoglobin (g/L) | 139.00 (127.00, 150.00) | 143.00 (130.00, 153.00) | 0.023 | |
| NT-proBNP (pg/mL) | 268.40 (109.20, 593.10) | 1012.00 (565.50, 1889.00) | ||
aMAPSE, anterior mitral annular plane systolic excursion; AF, atrial fibrillation; BSA, body surface area; TIA, transient ischemic attack; WBC, white blood cell; NT-proBNP, N-terminal pro b-type natriuretic peptide.
The study revealed that patients in the reduced aMAPSE group exhibited several significant echocardiographic changes. This group had an increased LA diameter, LVEDd, E/e’ ratio and sPAP, accompanied by a decreased LVEF. Moreover, the reduced aMAPSE group had a larger LAA area with a greater ostial diameter and depth. Furthermore, their LAA-EV, LAA-FV, conjunction thickening ratio and LAA FAC were also reduced. The prevalence of LAAT or dense SEC was also higher in the reduced aMAPSE group (Table 6).
| Variable | Normal aMPASE (n = 337) | Reduced aMAPSE (n = 128) | p | |
| Standard echocardiographic parameters | ||||
| LA diameter (mm) | 43.00 (40.00, 46.00) | 48.00 (44.00, 52.00) | ||
| LVEDd (mm) | 49.00 (46.00, 52.00) | 50.00 (47.00, 55.00) | ||
| LVEF (%) | 62.00 (58.00, 65.00) | 57.00 (47.00, 61.00) | ||
| E/e’ | 8.90 (7.10, 11.40) | 11.20 (8.30, 14.00) | ||
| sPAP (mmHg) | 26.00 (22.00, 29.00) | 28.00 (24.00, 32.00) | ||
| LAA structure parameters | ||||
| Number of LAA lobes | 3.22 (1.45) | 3.34 (1.42) | 0.440 | |
| LAAmax (cm |
286.15 (219.49, 366.02) | 342.18 (259.01, 438.60) | ||
| LAAmin (cm |
89.00 (32.78, 190.98) | 266.62 (177.78, 333.08) | ||
| LAA ostial diameter (mm) | 19.00 (16.00, 21.00) | 20.00 (18.00, 23.00) | ||
| LAA depth (mm) | 26.56 (5.74) | 29.19 (6.76) | ||
| LAA functional parameters | ||||
| LAA-EV (cm/s) | 47.00 (32.00, 69.00) | 23.00 (18.00, 31.00) | ||
| LAA-FV (cm/s) | 48.00 (34.00, 64.00) | 29.00 (20.00, 40.00) | ||
| Conjunction thickening ratio (%) | 23.73 (17.62, 30.20) | 11.37 (7.47, 14.67) | ||
| LAA FAC (%) | 63.14 (26.87) | 24.97 (14.71) | ||
| LAAT/dense SEC | 20 (5.93%) | 87 (67.97%) | ||
aMAPSE, anterior mitral annular plane systolic excursion; LA, left atrial; LVEDd, left ventricular end-diastolic diameter; LVEF, left ventricular ejection fraction; sPAP, systolic pulmonary arterial pressure; LAA, left atrial appendage; EV, emptying velocity; FV, filling velocity; LAAmax, maximum left atrial appendage area; LAAmin, minimum left atrial appendage area; FAC, fraction area change; LAAT, left atrial appendage thrombus; SEC, spontaneous echo contrast.
Univariate analysis revealed that being male, LVEF, LAA-EV, LAA-FV, conjunction
thickening ratio, and LAA FAC were positively correlated with aMAPSE. Conversely,
age, persistent AF, diabetes, congestive heart failure, CHA
| Variables | Univariate analysis | Multivariate analysis | ||
| OR (95% CI) | p | OR (95% CI) | p | |
| Gender | 0.05 (–0.75, 0.85) | |||
| Age | –0.07 (–0.10, –0.03) | 0.001 | ||
| BSA | 1.31 (–0.81, 3.43) | 0.224 | ||
| Persistent AF | –5.84 (–6.42, –5.27) | –1.07 (–2.04, –0.11) | 0.030 | |
| Diabetes | –1.15 (–2.28, –0.01) | 0.049 | ||
| Congestive heart failure | –2.09 (–3.55, –0.64) | 0.005 | ||
| CHA |
–0.32 (–0.58, –0.06) | 0.017 | ||
| Anticoagulants | –1.69 (–2.47, –0.92) | |||
| NT-proBNP | –0.00 (–0.00, –0.00) | |||
| LA diameter | –0.30 (–0.36, –0.25) | |||
| LVEDd | –0.17 (–0.25, –0.10) | |||
| LVEF | 0.21 (0.17, 0.25) | |||
| E/e’ | –0.22 (–0.31, –0.12) | |||
| sPAP | –0.14 (–0.20, –0.08) | |||
| LAA lobes | –0.24 (–0.52, 0.03) | 0.082 | ||
| LAAmax | –0.01 (–0.01, 0.01) | |||
| LAAT/Dense SEC | –5.71 (–6.47, –4.95) | |||
| LAA ostium | –0.25 (–0.35, –0.15) | |||
| LAA depth | –0.10 (–0.17, –0.04) | 0.001 | ||
| LAA-EV | 0.11 (0.10, 0.12) | 0.05 (0.02, 0.07) | ||
| LAA-FV | 0.09 (0.08, 0.11) | |||
| Conjunction thickening ratio | 0.29 (0.26, 0.32) | 0.08 (0.04, 0.13) | ||
| LAA FAC | 0.11 (0.10, 0.12) | 0.04 (0.02, 0.06) | ||
aMAPSE, anterior mitral annular plane systolic excursion; BSA, body surface area; AF, atrial fibrillation; NT-proBNP, N-terminal pro b-type natriuretic peptide; LA, left atrium; LVEDd, left ventricular end-diastolic diameter; LVEF, left ventricular ejection fraction; sPAP, systolic pulmonary arterial pressure; LAA, left atrial appendage; LAAmax, maximum left atrial appendage area; LAAT, left atrial appendage thrombus; SEC, spontaneous echo contrast; EV, emptying velocity; FV, filling velocity; FAC, fraction area change.
Assessing LAA function by TEE currently remains complex [8]. This study
evaluates the effectiveness of aMAPSE in predicting LAAT/dense SEC in patients
with NVAF. The main findings of the current study are: (1) Patients with
LAAT/dense SEC exhibited more severely impaired LAA function when compared to
those without LAAT or dense SEC, and both aMAPSE, LAA FAC were capable of
independently predicting LAAT/dense SEC. (2) Values of aMAPSE
In the current study, patients with increased LA size, impaired LVEF, and deteriorated LAA function were more likely to develop LAAT/dense SEC. This association can be explained by the coupling mechanism between the LA, LV, and LAA. The remolding of the LA in AF is characterized by LA dilation and myocardial fibrosis, which contribute to LA dysfunction and have been linked to LAA SEC and increased risk of thromboembolic events [21, 22, 23]. In AF patients, enlargement of the LA is often accompanied by an increase in left atrial pressure, which raises the LAA afterload, potentially impairing its function and leading to stasis [24, 25]. Furthermore, it’s widely accepted that LVEF is correlated with LAA flow velocity [24, 26]. The LAA undergoes stretching during LV systole and compression during LV diastole, indicating that LAA function is also affected by LV systolic function.
After assessing LAA structure parameters, we demonstrated that NVAF patients with LAAT/dense SEC had a larger LAA area, a finding consistent with previous studies [26, 27, 28, 29, 30]. Additionally, all LAA functional indices were reduced in patients with LAAT/dense SEC compared to those without LAAT/dense SEC. Presently, LAA flow velocity, measured by TEE remains, a key method for assessing LAA function. An LAA-EV of 40 cm/s or less is associated with a higher risk of LAA thrombus formation and subsequent embolic events, while an LAA-EV of 20 cm/s or below often indicates the presence of SEC in the LA/LAA [9]. Recently, LAA strain has emerged as a sensitive marker for assessing LAA function and predicting embolic strokes of undetermined source [31]. However, the practical application is limited since its operation is cumbersome and the requires off-line analysis [31].
Currently, the method of assessing LAA function through TEE is relatively
limited and not as well-developed as the evaluation of ventricular and atrial
function. The lower surface of the LAA usually overlies the anterior and lateral
wall of the LV, and is situated adjacent to the base of the anterior LV wall
[14]. Based on this anatomical relationship, we speculate that aMAPSE can be
utilized to assess LAA function. This study found aMAPSE correlates well with LAA
flow velocity and other LAA function parameters. Additionally, aMAPSE
independently correlated with LAAT/dense SEC and aMAPSE
Research by Ono et al. [13] demonstrated that LAAEF was an independent determinant of LAAT in NVAF patients with a low CHADS2 score. However, the LAAEF was measured using the Simpson method, which assumes a bullet shaped LAA [13, 32]. This assumption is problematic since the LAA can resemble a finger or stump, and may present in one of four morphological types, with ‘chicken wing’ being the most prevalent (48%), followed by ‘cactus’, ‘windsock’, and ‘cauliflower’ [33]. Therefore, using the Simpson method for calculating LAAEF may not be appropriate. Instead, measuring the LAA FAC using TEE at a suitable angle, may provide a more accurate assessment of LAA function. The current study found that LAA FAC not only correlated independently with LAAT/dense SEC, but accurately predicted LAAT/dense SEC, highlighting its significant potential for assessing the risk of thromboembolic events in NVAF patients.
There are several limitations of this study that warrant consideration. First and foremost, being a single-center study inherently presents potential risks for confounders and biases, which may limit the generalizability of the results. Second, as a cross-sectional investigation, this study did not conclusively establish a correlation between aMAPSE and future thromboembolic events. Finally, the inclusion of only NVAF patients who underwent TEE performed by a single operator limits the study to a specific subset of patients, rather than a more diverse population.
In conclusion, our findings underscore that both aMAPSE and LAA FAC, characterized by their remarkable accessibility and reproducibility, independently correlated with LAAT or dense SEC and demonstrate high diagnostic accuracy for predicting LAAT or dense SEC. Thus, it may be beneficial to integrate aMAPSE into routine TEE evaluations of LAA function in addition to LAA flow velocity.
The datasets used and/or analyzed during the current study are available from the corresponding author on reasonable request.
All authors contributed the study conception and design. JLF, HPW and YL wrote the manuscript. JLF and HPW performed the statistical analysis. CSM and HW were responsible for image off-line analysis. CSM and HW reviewed and edited the manuscript before submission. All authors read and approved the final manuscript. All authors have participated sufficiently in the work and agreed to be accountable for all aspects of the work.
Study approval was obtained from the institutional enrolling board of the first affiliated hospital of Soochow university (Ethics approval number is No.114/2024). Informed consent was obtained from all individual participants included in the study.
Not applicable.
This research received no external funding.
The authors declare no conflict of interest.
References
Publisher’s Note: IMR Press stays neutral with regard to jurisdictional claims in published maps and institutional affiliations.