Objective: This study aimed to determine the ED50 and ED95 of 10 mg of
0.5% ropivacaine combined with different doses of sufentanil in lumbar
anesthesia for cesarean sections in patients with severe preeclampsia by the
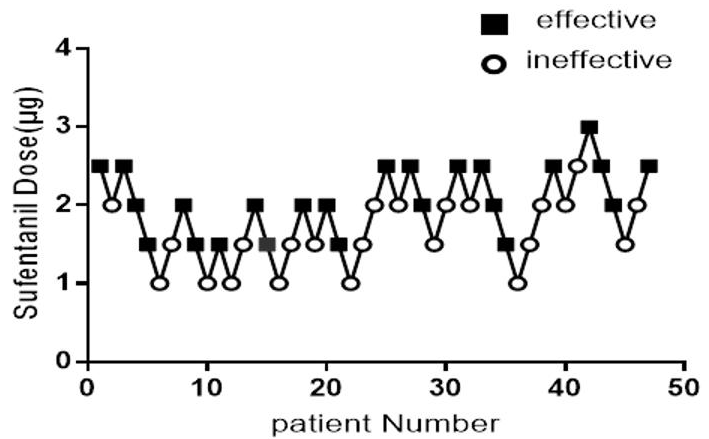
sequential method. Methods: A total of 47 patients with severe
preeclampsia, who underwent cesarean section, were enrolled in
the present study. The first patient was given a subarachnoid
injection of 10 mg of isobaric 0.5% ropivacaine plus 2.5 g of sufentanil.
If the anesthetic effect was satisfactory, the dose of sufentanil used for the
next patient was reduced by 0.5 g. If the anesthetic effect was
unsatisfactory, the dose of sufentanil used for the next patient was increased by
0.5 g. Results: The ED50 of sufentanil was 1.830
g, with a 95% CI ranging within 1.517-2.128 g, while the ED95 of
sufentanil was 2.852 g with a 95% CI ranging within 2.429-4.338
g. Conclusion: The ED50 and ED95 of 10 mg of isobaric 0.5%
ropivacaine combined with different doses of sufentanil in lumbar anesthesia for
cesarean sections in patients with severe preeclampsia were 1.830 g and
2.852 g, respectively.