
- Academic Editor
†These authors contributed equally.
Background: Plasma neurofilament light (NfL) is an intermediate
filamentous protein involved in stabilizing axonal structure and promoting axon
growth. Recent clinical studies have reported increased NfL levels in the plasma
of Alzheimer’s disease (AD) patients and patients with mild cognitive impairment
(MCI). This study used meta-analysis to evaluate the potential of plasma NfL as a
biomarker for patients with AD and MCI. Methods: PubMed, Embase, and Web
of Science databases were systematically searched for studies of plasma NfL
levels in AD and MCI, and a meta-analysis was employed to identify whether it was
suited as a reliable biomarker and discrimination of healthy controls.
Results: A total of 24 published articles that included 2397 AD and 3242
MCI patients were analysed. The level of plasma NfL was significantly increased
in patients with AD and MCI when compared with healthy control subjects (standard
mean difference [SMD]: 14.33 [12.42–16.24], z = 14.71, p
Alzheimer’s disease (AD), a severe neurodegenerative disease of the central nervous system that usually occurs in senile and pre-senile patients, is characterized by progressive loss of thinking, memory, language, and impairment of cognitive ability. It is the most common form of dementia in old age, with about 60% to 80% of the dementia diagnosed in people over 65 years old being attributed to it [1]. New cases of AD are projected to increase to more than 1 million by 2050, which will place an enormous financial burden on families and society [2]. Mild cognitive impairment (MCI) is an intermediate stage in which a person has problems with memory, language, or other cognitive functions that can be detected by others or by testing but is not serious enough to affect the activities of daily living [3]. If it is not prevented from progressing in a timely manner, such subjects are at a significantly increased risk of evolving toward AD at the rate of 15–25% over two years [4, 5]. However, there are neither disease-modifying therapies nor successful late-stage clinical trials currently available [6]. It is believed that continuous pathophysiological changes begin many years prior to clinical symptom onset, thus further investigations is required with the aim of discovering a practical biomarker for the early diagnosis and detection of AD.
Neurofilaments (Nfs) are intermediate filamentous proteins, expressed in neurons and particularly abundant in axons, responsible for the structural stability of axon morphology, forming the neuronal cytoskeleton, and maintaining cytoarchitecture and transport functions [7]. Nfs are divided by molecular weight into three subunits, the neurofilament heavy, medium, and light chains [8]. Neurofilament light chain (NfL) has the lowest molecular weight, and is thought to be the leading Nfs for stabilization of axonal structure and the promotion of axon growth [9, 10]. There are many studies demonstrating that NfL levels are higher in AD patients than controls, associated with poorer cognitive performance, and short survival time in demented patients [11]. NfL was used as a specifically diagnostic biomarker, meanwhile, it is potentially a valuable tool for the detection of the initial pathological changes associated with AD, even at the MCI stage, while in the differential diagnosis, monitoring, and prognosis of AD. Recently, there has been great interest in the utility of NfL in plasma as a biomarker for AD. It avoids the invasiveness of cerebrospinal fluid (CSF) sampling, which is restricted in its clinical application [12].
This meta-analysis aimed to investigate whether NfL in peripheral blood is accompanied by improved levels of AD or MCI and to evaluate NfL as a cognitive biomarker for the diagnosis of AD and MCI. The findings reported here may be used for risk assessment and assessment of disease progression, even for clinically aided diagnosis of MCI or AD. Plasma NfL levels were measured in three groups of patients, AD, MCI, and healthy subjects, obtained from cross-sectional and longitudinal studies.
The meta-analysis was conducted according to the guidelines of the Preferred Reporting Items for Systematic Review and Meta-analysis (PRISMA) [13]. PRISMA checklist is shown in Supplementary Material. Two independent investigators (MZ and XL) performed a systematic literature research in English through June 2022 in the following three electronic databases: PubMed, Embase, and Web of Science. The search strategy was by Mesh phrases and keywords included (neurofilament light chain OR NfL) AND (plasma) AND (Alzheimer’s disease OR Mild cognitive impairment). All articles were imported into the management software. Two investigators independently screened the titles, abstracts, and full texts of the most eligible publications. Any conflicts were resolved through discussion or, if necessary, adjudicated by a third investigator (ZF).
All of the included publications compared peripheral NfL data in AD or MCI patients with controls. The qualifying studies satisfied the following criteria, including: (a) Study designs must be either cross-sectional or longitudinal; (b) Studies must include AD and/or MCI patients and healthy controls; (c) AD and MCI patients must fulfil the diagnosis criteria of National Institute of Neurological and Communicative Disorders and Stroke and the Alzheimer’s Disease and Related Disorders Association (NINCDS-ADRDA) Criteria [14], or National Institute on Aging and Alzheimer’s Association (NIA-AA) Criteria [15] or Petersen (Mayo Clinic) diagnostic criteria [16]; (d) The NfL concentration of plasma must be one of the main interests in patients with AD or MCI and in the healthy control group; (e) The article must report NfL levels in plasma measured with an in-house assay on the single molecule array platform (Simoa); (f) The study should be available from the original paper rather than case-reports, protocols, conference abstracts, reviews, or meta-analyses. Studies were excluded according to the following criteria: (a) Non-human studies; (b) The number of subjects was less than 20; (c) Studies without healthy controls or without disease controls; (d) Articles that were unrelated to NfL, AD, or MCI; (e) Studies with missing data such as details about demographic information and the method employed to measure NfL.
One investigator independently extracted the following data from every study for the purposes of this meta-analysis, and another investigator independently checked them to ensure accuracy. The relevant data extracted included the name of the first author, year of publication, study design, number of the AD or MCI patients and healthy control groups, the average age, percentage of females, diagnosis criteria of AD and MCI, the plasma concentration of NfL, the measurement methods of NfL, and a Mini-Mental State Examination (MMSE). This information was entered into a standardized Excel spreadsheet with any disagreement resolved by discussion and agreement.
The Newcastle-Ottawa scale (NOS) was employed to assess the quality of the available studies [17]. The assessment process was individually performed by two investigators, and any discrepancy was solved by discussion or by a third investigator. NOS scores range from zero to nine, with a higher score indicating better quality. A study was given a maximum score of one star for each numbered item within three domains: The Selection (0–4 scores), Comparability (0–2 scores), and Exposure categories (0–3 scores). A score greater than five was considered to imply that the study was of high quality. The more stars allocated, the better the quality.
Review Manager (version 5.3, Cochrane Collaboration, Oxford, United Kingdom) and
Stata statistical software (version 14.0,
Stata Corporation, College Station, TX, USA) were used to pool all statistical
analyses. The statistical analysis was performed using a standardized mean
difference methodology. When only median and interquartile ranges were available
from the included articles, means and standard deviations were estimated
following Wan et al. [18] and Luo et al. [19]. The standardized
mean difference (SMD) and corresponding 95% confidence interval (CI) were
calculated, and forest plots were generated to compare the mean plasma NfL levels
between AD or MCI patients with healthy controls (HC). Either a random-effects or
a fixed-effects model was based on the heterogeneity of the articles for each
comparison. In the following statistical analysis, an overall meta-analysis was
performed for AD vs. HC, MCI vs. HC, and AD vs. MCI. Heterogeneity between the
studies was assessed by the I
According to the search strategy, a total of 1316 articles were obtained from the three databases. Among them, 520 duplicate articles were removed. By screening the titles and abstract reviews, 680 articles were excluded for the following reasons: 40 were irrelevant topics, 119 were reviews, 43 used non-human subjects, 123 were conferences, editorials or meta-analysis, 262 were non-primary dementia studies, and 93 were not related to either plasma NfL or analytical methods for NfL. 116 potentially relevant publications were subjected to full-text reviews. Ninty-two publications were excluded for the following reasons: 43 were not controlled studies, 30 had incomplete or unavailable data, 9 lacked necessary plasma NfL data, 8 were non-dementia studies, and 2 had a total sample size less than 20. The Flow Diagram showing the detailed process of selection is given in Fig. 1. Table 1 (Ref. [20, 21, 22, 23, 24, 25, 26, 27, 28, 29, 30, 31, 32, 33, 34, 35, 36, 37, 38, 39, 40, 41, 42, 43]) presents a summary of the main characteristics of the included studies.
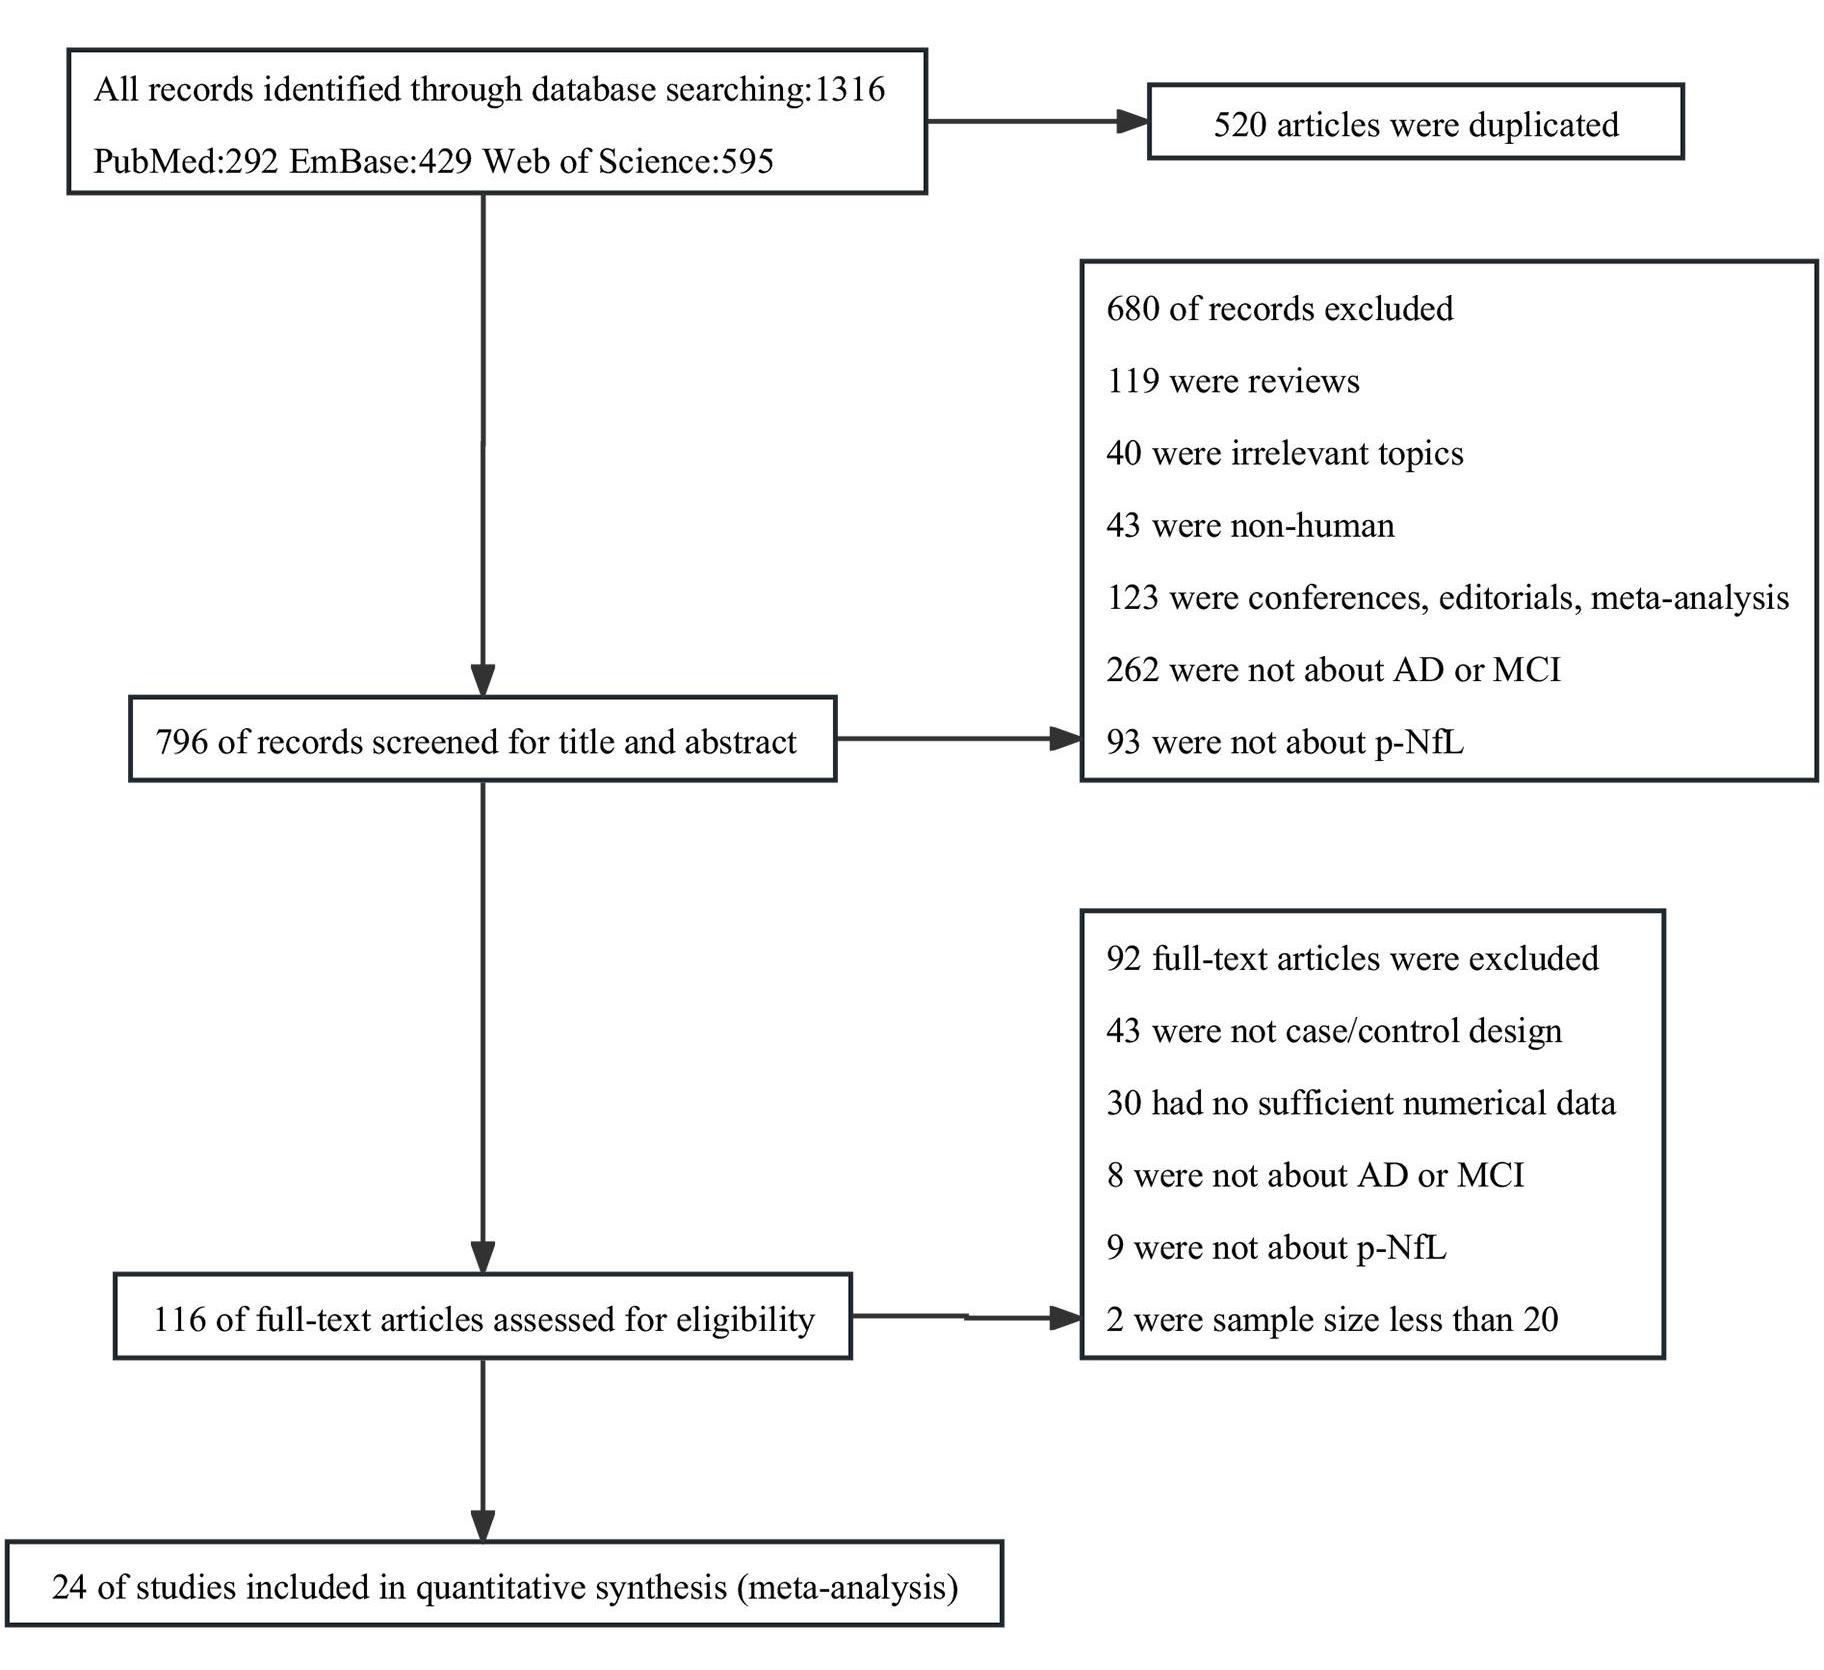 Fig. 1.
Flow diagram of studies selected for meta-analysis.
| Author, Year | Country | Study group | N | Sex (F/M) | Age | MMSE | p-NfL level | Type of study | Analytical method |
| Andersson et al., 2020 [20] | Sweden (BioFINDER) | AD | 113 | 72/41 | 75 (7.2) | 21.7 (3.7) | 42 (26) | cross-sectional | Simoa |
| MCI | 227 | 92/135 | 70.6 (5.4) | 27.1 (1.8) | 28 (23) | ||||
| HC | 478 | 278/200 | 72.1 (5.5) | 28.9 (1.2) | 23 (34) | ||||
| Barker et al., 2021 [21] | America (ADRC) | AD | 156 | 88/68 | 74.8 (8.2) | 25.3 (4.3) | 21.9 (13.1) | cross-sectional | Simoa |
| HC | 51 | 40/11 | 70.8 (5.9) | 29.4 (0.8) | 14.2 (6.1) | ||||
| Brickman et al., 2021 [22] | Spain, America | AD | 131 | 69/62 | 82.99 (6.49) | NR | 36.55 (24.63) | cross-sectional | Simoa |
| HC | 169 | 64/105 | 81.01 (6.31) | NR | 31.10 (28.96) | ||||
| Janelidze et al., 2021 [23] | Sweden (BioFINDER) | MCI | 164 | 79/85 | 71 (7.48) | 27 (2.99) | 16.35 (8.49) | cross-sectional | Simoa |
| HC | 350 | 183/167 | 64 (16.38) | 29 (1.49) | 12.13 (6.45) | ||||
| Karikari et al., 2021 [24] | America, Canada (ADNI) | AD | 219 | 89/130 | 75.9 (7.9) | 22.7 (3.0) | 51.2 (22.6) | cross-sectional | Simoa |
| MCI | 558 | 237/321 | 72.9 (7.9) | 28.0 (1.8) | 40.7 (23.5) | ||||
| HC | 400 | 213/187 | 74.8 (6.6) | 29.0 (1.3) | 38.2 (23.0) | ||||
| Illán-Gala et al., 2021 [25] | America | AD | 43 | 27/16 | 65.2 (10) | 21.5 (6) | 28.5 (11) | cross-sectional | Simoa |
| HC | 55 | 30/25 | 52.2 (13) | 28.9 (1) | 12.1 (4) | ||||
| Hall, J.R. et al., 2020 [26] | America | MCI | 98 | 63/35 | 65.6 (8.48) | 23.9 (3.65) | 19.63 (2.19) | cross-sectional | Simoa |
| HC | 413 | 326/87 | 59.2 (6.97) | 27.0 (2.60) | 16.03 (1.7) | ||||
| Lewczuk et al., 2018 [27] | Germany | AD | 33 | 20/13 | 70.8 (7.6) | 21.2 (3.4) | 49.1 (28.4) | cross-sectional | Simoa |
| MCI | 25 | 15/10 | 71.3 (8.4) | 26.7 (2.1) | 38.1 (15.9) | ||||
| HC | 41 | 19/22 | 52.5 (13.1) | 29.3 (0.9) | 22.0 (12.4) | ||||
| Li, J.Q. et al., 2018 [28] | America, Canada (ADNI-1) | AD | 172 | 82/90 | 76 (7) | NR | 48.7 (20.9) | cross-sectional | Simoa |
| MCI | 176 | 59/117 | 75 (8) | NR | 39.9 (17.7) | ||||
| HC | 179 | 76/103 | 76 (5) | NR | 32.8 (15.5) | ||||
| Lin, Y.S. et al., 2018 [29] | China | AD | 119 | 63/56 | 77.3 (5.1) | 18.6 (6.2) | 32.9 (25.5) | cross-sectional | Simoa |
| MCI | 56 | 29/27 | 76.0 (5.6) | 26.4 (2.3) | 20.0 (7.3) | ||||
| HC | 59 | 28/31 | 77.0 (6.2) | 27.8 (2.1) | 17.8 (6.4) | ||||
| Liu, Shunjue et al., 2020 [30] | China | AD | 74 | 42/32 | 73.2 (5.46) | 21.12 (1.99) | 46.07 (25.16) | cross-sectional | Simoa |
| HC | 60 | 34/36 | 71.95 (4.74) | 28.53 (1.62) | 26.26 (20.05) | ||||
| Mattsson et al., 2017 [31] | America, Canada (ADNI) | AD | 180 | 86/94 | 75.3 (7.3) | 23.2 (2.1) | 51.0 (26.9) | Longitudinal | Simoa |
| MCI | 197 | 65/132 | 74.7 (7.5) | 26.9 (1.8) | 42.8 (29.0) | ||||
| HC | 193 | 87/106 | 75.9 (4.9) | 29.1 (1.0) | 34.7 (21.4) | ||||
| Osborn et al., 2019 [32] | Sweden | MCI | 159 | 65/94 | 73 (7.7) | NR | 23.96 (15.4) | cross-sectional | Simoa |
| HC | 174 | 71/103 | 72 (7.0) | NR | 17.50 (9.2) | ||||
| Palmqvist et al., 2019 [33] | Sweden (BioFINDER) | AD | 64 | 39/25 | 76 (5) | 21.8 (3.7) | 43.8 (28.7) | Longitudinal | Simoa |
| MCI | 157 | 78/79 | 72 (5) | 26.7 (1.8) | 29.0 (17.9) | ||||
| HC | 366 | 214/152 | 72 (5) | 28.9 (1.1) | 21.0 (11.8) | ||||
| Pereira et al., 2017 [34] | America, Canada (ANDI) | AD | 65 | 31/34 | 73.7 (7.6) | 23.5 (1.8) | 43.4 (21.1) | cross-sectional | Simoa |
| MCI | 109 | 42/67 | 74.2 (6.9) | 26.7 (1.8) | 44.1 (31.1) | ||||
| HC | 57 | 30/27 | 74.8 (5.2) | 29 (1) | 31 (15.8) | ||||
| Shi. et al., 2019 [35] | China | MCI | 68 | 39/29 | 64.53 (7.68) | 27.26 (1.67) | 7.0 (3.18) | cross-sectional | Simoa |
| HC | 87 | 51/36 | 64.77 (7.40) | 28.55 (1.16) | 5.8 (2.27) | ||||
| Simrén et al., 2021 [36] | Europe (AddNeuroMed) | AD | 103 | 63/40 | 76.35 (5.76) | 21.07 (4.42) | 32.47 (15.29) | cross-sectional | Simoa |
| MCI | 107 | 56/51 | 74.47 (5.89) | 27.21 (1.82) | 25.96 (15.56) | ||||
| HC | 99 | 53/46 | 73 (6.14) | 29.07 (1.26) | 18.35 (8.68) | ||||
| Sugarman et al., 2020 [37] | America (BU ADRC) | AD | 156 | 69/87 | 76.74 (8.12) | 21.11 (6.17) | 26.49 (17.30) | cross-sectional | Simoa |
| MCI | 185 | 108/77 | 74.99 (7.24) | 28.20 (1.67) | 17.77 (10.25) | ||||
| HC | 238 | 149/89 | 72.38 (7.69) | 29.39 (0.91) | 15.33 (10.47) | ||||
| Walsh et al., 2021 [38] | America, Canada (ANDI) | AD | 130 | 57/73 | 74.2 (8.0) | 23.1 (2.1) | 47.5 (22.7) | cross-sectional | Simoa |
| MCI | 431 | 196/235 | 71.5 (7.5) | 28.0 (1.7) | 37.9 (19.7) | ||||
| HC | 163 | 86/77 | 73.6 (6.2) | 29.0 (1.3) | 36.6 (24.0) | ||||
| Zhou et al., 2017 [39] | America, Canada (ANDI) | AD | 187 | 90/97 | 75.5 (7.4) | 23.3 (2.1) | 50.9 (26.8) | cross-sectional | Simoa |
| MCI | 198 | 65/133 | 74.5 (7.4) | 26.9 (1.8) | 43.0 (29.1) | ||||
| HC | 193 | 87/106 | 75.7 (4.9) | 29.1 (0.99) | 34.7 (21.4) | ||||
| Chu et al., 2021 [40] | America (ADRC) | AD | 22 | 10/12 | 71.5 (9.2) | 19.1 (7.8) | 34.4 (30.5) | cross-sectional | Simoa |
| MCI | 100 | 51/49 | 73.4 (7.9) | 27.6 (2.7) | 19.6 (11.1) | ||||
| HC | 30 | 21/9 | 70.5 (6.7) | 29.3 (1.0) | 13.3 (4.7) | ||||
| Jiao et al., 2021 [41] | China | AD | 277 | 172/105 | 65.11 (10.57) | 12 (6.44) | 28.76 (30.34) | cross-sectional | Simoa |
| HC | 153 | 99/54 | 64.5 (8.2) | 27.7 (2.3) | 14.13 (10.25) | ||||
| Frank et al., 2022 [42] | America (BU ADRC) | AD | 153 | 67/86 | 76.82 (8.13) | 21.12 (6.21) | 26.57 (17.45) | cross-sectional | Simoa |
| MCI | 181 | 105/76 | 74.96 (7.25) | 28.20 (1.68) | 17.61 (9.89) | ||||
| HC | 235 | 148/87 | 72.38 (7.69) | 29.39 (0.91) | 15.43 (10.51) | ||||
| Alcolea et al., 2021 [43] | Spain | MCI | 46 | 28/18 | 72.6 (6.5) | 25.8 (2.7) | 16.8 (9.3) | cross-sectional | Simoa |
| HC | 46 | 24/22 | 54.8 (12.3) | 29.1 (1.1) | 8.9 (5) |
Note: AD, Alzheimer’s disease; MCI, mild cognitive impairment; HC, healthy controls; BioFINDER, Biomarkers For Identifying Neurodegenerative Disorders Early and Reliably; ADNI, Alzheimer’s Disease Neuroimaging Initiative; BU, Boston University; ADRC, Wisconsin Alzheimer’s Disease Research Center; MMSE, Mini-Mental State Examination; Simoa, Single-molecule Array; NR, not reported.
The NOS assessment tool was used to independently evaluate the quality of the articles by two authors (MZ and XL), as shown in Table 2 (Ref. [20, 21, 22, 23, 24, 25, 26, 27, 28, 29, 30, 31, 32, 33, 34, 35, 36, 37, 38, 39, 40, 41, 42, 43]). A study was awarded a maximum score of one star for each numbered item within the Selection (0–4 points) and Exposure (0–3 points) categories. A maximum score of up to two stars was given to a study for its Comparability (0–2 points). Generally, the quality of the studies was moderate and high, with the more stars allocated to a study, the better quality the methodology employed. All the publications in this review scored greater than or equal to six stars, indicating good quality.
| Case-control studies | ||||
| Author, year | Selection | Comparability | Exposure | Score |
| Andersson et al., 2020 [20] | ☆☆☆☆ | ☆☆ | ☆☆ | 8 |
| Barker et al., 2021 [21] | ☆☆☆ | ☆☆ | ☆☆☆ | 8 |
| Brickman et al., 2021 [22] | ☆☆☆☆ | ☆☆ | ☆ | 7 |
| Janelidze et al., 2021 [23] | ☆☆☆☆ | ☆☆ | ☆ | 7 |
| Karikari et al., 2021 [24] | ☆☆☆ | ☆☆ | ☆☆ | 7 |
| Illán-Gala et al., 2021 [25] | ☆☆☆ | ☆☆ | ☆☆ | 7 |
| Hall, J.R. et al., 2020 [26] | ☆☆☆ | ☆☆ | ☆ | 6 |
| Lewczuk et al., 2018 [27] | ☆☆ | ☆☆ | ☆☆ | 6 |
| Li, J.Q. et al., 2018 [28] | ☆☆☆ | ☆☆ | ☆☆ | 7 |
| Lin, Y.S. et al., 2018 [29] | ☆☆ | ☆☆ | ☆☆ | 6 |
| Liu, Shunjie et al., 2020 [30] | ☆☆☆☆ | ☆☆ | ☆☆ | 8 |
| Mattsson et al., 2017 [31] | ☆☆☆ | ☆☆ | ☆☆ | 7 |
| Osborn et al., 2019 [32] | ☆☆☆ | ☆☆ | ☆ | 6 |
| Palmqvist et al., 2019 [33] | ☆☆☆ | ☆☆ | ☆☆ | 7 |
| Pereira et al., 2017 [34] | ☆☆☆ | ☆☆ | ☆ | 6 |
| Shi et al., 2019 [35] | ☆☆☆ | ☆☆ | ☆☆ | 7 |
| Simren et al., 2021 [36] | ☆☆☆ | ☆☆ | ☆ | 6 |
| Sugarman et al., 2020 [37] | ☆☆☆ | ☆☆ | ☆ | 6 |
| Walsh et al., 2021 [38] | ☆☆☆ | ☆☆ | ☆ | 6 |
| Zhou et al., 2017 [39] | ☆☆☆ | ☆☆ | ☆ | 6 |
| Chu et al., 2021 [40] | ☆☆☆ | ☆☆ | ☆☆ | 7 |
| Jiao et al., 2021 [41] | ☆☆☆ | ☆☆ | ☆☆ | 7 |
| Frank et al., 2022 [42] | ☆☆☆ | ☆☆ | ☆☆ | 7 |
| Alcolea et al., 2021 [43] | ☆☆☆ | ☆☆ | ☆☆☆ | 8 |
Plasma neurofilament light chain levels in AD patients were compared with those
in HC subjects [20, 21, 22, 24, 25, 27, 28, 29, 30, 31, 33, 34, 36, 37, 38, 39, 40, 42] with extracted data from 19
studies comprising a sample of 2397 AD subjects and 3219 HC subjects. The
heterogeneity of these studies was high (Tau
 Fig. 2.
Forest plot of random effects meta-analysis of plasma NfL levels in AD patients and HC subjects.
The NfL levels between MCI subjects and healthy controls were then compared; the
total number of MCI and HC subjects were 3242 and 3801, respectively, from 19
studies [20, 23, 24, 26, 27, 28, 29, 31, 32, 33, 34, 35, 36, 37, 38, 39, 40, 42, 43]. Results showed a trend of high plasma NfL
levels in MCI patients when compared with healthy control subjects (SMD: 4.95
[3.82–6.08], z = 8.59, p
 Fig. 3.
Forest plot of random effects meta-analysis of plasma NfL levels in MCI patients and HC subjects.
Fourteen studies including 1716 AD and 2707 MCI subjects tested NfL levels in
the plasma [20, 24, 27, 28, 29, 31, 33, 34, 36, 37, 38, 39, 40, 42]. Results demonstrated a significantly
higher mean level of plasma NfL in the AD subjects when compared with MCI (SMD:
9.32 [8.07–10.57], z = 14.62, p
 Fig. 4.
Forest plot of fixed effects meta-analysis of plasma NfL levels in AD and MCI patients.
Meta-regression analysis was conducted, and the results showed that age, gender
(male ratio), and MMSE scores could not be regarded as possible sources of the
heterogeneity observed between AD subjects and HC subjects (see Table 3).
Subgroup analyses were performed to identify the cause of high heterogeneity in
the comparison of plasma NfL levels between AD and healthy controls. It revealed that the different sex ratio and MMSE
| Group | Moderators | Coef. | 95% CI | p | |
| AD vs. HC | Age | –0.035 | –0.083 | 0.013 | 0.144 |
| Gender | –0.014 | –0.039 | 0.011 | 0.260 | |
| MMSE | –0.002 | –0.073 | 0.070 | 0.960 | |
| MCI vs. HC | Age | –0.052 | –0.120 | 0.017 | 0.129 |
| Gender | –0.018 | –0.038 | 0.003 | 0.091 | |
| MMSE | –0.400 | –0.519 | –0.281 | 0.000 | |
Note: AD, Alzheimer’s disease; MCI, mild cognitive impairment; HC, healthy controls; NfL, neurofilament light chain; MMSE, Mini-Mental State Examination; CI, confidence interval.
| Group | Assign criteria | No. of studies | SMD | 95% CI | Heterogeneity | |||
| Q | p | I | ||||||
| AD vs. HC Subgroup | ||||||||
| Sample size | small | 9 | 1.071 | 0.774 | 1.367 | 53.11 | 0.000 | 84.9% |
| large | 10 | 0.633 | 0.514 | 0.752 | 27.10 | 0.001 | 66.8% | |
| Age (years) | matched | 7 | 0.955 | 0.610 | 1.300 | 42.08 | 0.000 | 85.7% |
| mismatched | 12 | 0.755 | 0.596 | 0.914 | 62.96 | 0.000 | 82.5% | |
| Proportion of men | 10 | 0.927 | 0.633 | 1.220 | 91.32 | 0.000 | 90.1% | |
| 9 | 0.702 | 0.605 | 0.799 | 12.43 | 0.133 | 35.6% | ||
| MMSE | 3 | 0.668 | 0.477 | 0.858 | 2.36 | 0.307 | 15.3% | |
| 14 | 0.867 | 0.697 | 1.038 | 78.64 | 0.000 | 83.5% | ||
| MCI vs. HC Subgroup | ||||||||
| Sample size | small | 11 | 0.757 | 0.458 | 1.055 | 121.01 | 0.000 | 91.7% |
| large | 8 | 0.216 | 0.134 | 0.299 | 11.89 | 0.104 | 41.1% | |
| Age (years) | matched | 7 | 0.701 | 0.242 | 1.160 | 182.81 | 0.000 | 96.7% |
| mismatched | 12 | 0.389 | 0.269 | 0.509 | 34.45 | 0.000 | 68.1% | |
| Proportion of men | 9 | 0.734 | 0.300 | 1.167 | 158.18 | 0.000 | 94.9% | |
| 10 | 0.346 | 0.216 | 0.476 | 41.75 | 0.000 | 78.4% | ||
Note: AD, Alzheimer’s disease; MCI, mild cognitive impairment; HC, healthy controls; MMSE, Mini-Mental State Examination; SMD, standard mean difference; CI, confidence interval.
It was also found that for the comparison of plasma NfL levels between MCI and
controls, the meta-regression analysis result showed a negative relationship
(slope = –0.400 [95% CI: –0.519 to –0.281], p
In the present study, publication bias was evaluated by visual inspection of a
funnel plot and then confirmed by Egger’s test. There was significant publication
bias for plasma NfL level comparisons between AD and HC (t = 2.69,
p = 0.016) and MCI and HC (t = 2.38, p = 0.03), while
the results of Egger’s test confirmed no significant publication bias among
patients with AD and MCI. When six and eight virtual studies were separately
added using the trim-and-fill-method the publication bias remained significant
(all p
 Fig. 5.
Funnel plot of plasma NfL levels. (A) AD patients and HC subjects. (B) MCI patients and HC subjects. (C) AD and MCI patients.
Alzheimer’s patients have a long, mild pre-clinical phase of cognitive impairment before showing the clinical symptoms typical of dementia. A clinical performance on memory impairment characterized as amnestic MCI (aMCI), a subtype of MCI, has increasingly been accepted as a high-risk condition for conversion to AD. Unfortunately, currently there are no effective treatments available to halt, slow, or reverse the progression of AD. Consequently, there is a significant clinical need for rapid and non-invasive diagnostic biomarkers to identify AD or MCI patients. Low levels of NfL can be detected in the blood and CSF of normal persons, with an increased concentration of NfL correlated with age. Recent research suggests that NfL is abnormally released into the CSF and blood with damage and degeneration following damage to various central and peripheral neurons [10]. The exact mechanism is not completely understood, although it most probably involves the destruction of cell membrane integrity. Recently, studies have suggested that NfL levels in the CSF and blood play an important role in patients with AD or MCI. In this study, due to the fact that it is inexpensive and simple to acquire, meta-analysis was used to explore the peripheral blood, for the development of diagnostic biomarkers of patients with AD or MCI. Plasma NfL levels may serve as one of the most promising fluid biomarkers for the validation of AD or MCI diagnosis [44]. Further, some animal studies have also reported that NfL is a potentially reliable biomarker for the severity of neuronal apoptosis [20, 45]. Although there is a potential rationale that NfL can be regarded as a measure of the intensity of ongoing AD or MCI, the data remain controversial. Other work corroborates that there is no significant association between plasma NfL and cognitive decline [46]. Here, a total of 24 studies were extracted from the literature for this meta-analysis, and the following findings were obtained: Firstly, the level of NfL in plasma of patients with AD and MCI increased, simultaneously, and it was higher in patients with AD than in MCI subjects. Secondly, the concentration of NfL in plasma increased with cognitive decrease and was negatively correlated with MMSE scores. These findings provide clinical evidence that peripheral NfL levels can potentially be used as a biomarker for AD and MCI.
In the last few years, new biomarkers have emerged for the early diagnosis of
AD, among which plasma NfL has recently been considered as a diagnostic and
prognostic biomarker for the preclinical stages of AD [47]. NfL levels in the
plasma are closely related to several traditional biomarkers of AD, including
amyloid beta (A
In summary, these findings further validated that NfL in plasma can be used as a significant cognitive biomarker that distinguishes patients with AD and MCI from HC, but that the different ranges of NfL are unable to identify the different stages of the disease; therefore, in the future, other studies are needed to define the optimal range of plasma NfL values for prediction at the different stages of the disease.
There were several limitations to the meta-analysis reported here. Firstly, despite an exhaustive literature search, it is possible that some studies may have been missed and some publications had to be excluded due to small sample size and low quality. Secondly, the trim-and-fill-method which detects and adjusts for publication bias may affect the robustness of the results reported here. Thirdly, a high heterogeneity was found in this meta-analysis where comparison of AD with HCs and MCI with HCs may have reduced its statistical power.
The results of this meta-analysis suggest that there was a significant difference of plasma NfL between AD, MCI and the healthy controls and that there was a correlation between plasma NfL and cognitive dysfunction levels. From these results, it can be concluded that plasma NfL can serve as a biomarker for AD or MCI, but it cannot discriminate AD from other dementias or neurodegenerative diseases. Given the limited data, more cohort studies are required to confirm the results reported here.
AD, Alzheimer’s disease; MCI, mild cognitive impairment; Nfs, neurofilaments;
NfL, neurofilament light; CSF, cerebrospinal fluid; PRISMA, Preferred Reporting
Items for Systematic Review and Meta-analysis; NINCDS-ADRDA, National Institute
of Neurological and Communicative Disorders and Stroke and the Alzheimer’s
Disease and Related Disorders Association; NIA-AA, National Institute on Aging
and Alzheimer’s Association; Simoa, single molecule array; MMSE, Mini-Mental
State Examination; NOS, Newcastle-Ottawa scale; SMD, standardized mean
difference; CI, confidence interval; A
The datasets analyzed in this article are available upon request to: zmnb1989@163.com.
MZ and ZF designed the review. XL and JL collected and analyzed the data. CC was responsible for the result analysis and make figures. ZF and CC supervised the procedures. MZ wrote the manuscript. All authors contributed to editorial changes in the manuscript. All authors read and approved the final manuscript. All authors have participated sufficiently in the work and agreed to be accountable for all aspects of the work.
Not applicable.
Not applicable.
This research was funded by Zhejiang Medicine and Health Science and Technology Project, grant number 2020KY848; the Project of NINGBO Leading Medical & Health Discipline, grant number 2022-B12.
The authors declare no conflict of interest.
Publisher’s Note: IMR Press stays neutral with regard to jurisdictional claims in published maps and institutional affiliations.