
Academic Editor: Grant Pierce
Background: Evidence points to adverse effects of trans fatty acids
(TFA) on health. The aim of this study was to estimate total TFA intake, evaluate
major food contributors and its effect on dyslipidemia. Methods: A total of 3537 adults (48.3% males) were included. Total TFA intake
was assessed using two 24-hour dietary recalls. Foods were categorized into
specific food groups. Adjusted Logistic Regression analysis was performed to
assess the likelihood of dyslipidemia by tertile of TFA aand Saturated Fatty Acid
(SFA) level. Results: Median TFA intake was 0.53% of energy
(from 0.34 to 0.81) ranging from 0.27 (Q1) to 0.95 (Q3) (p
Cardiovascular diseases (CVD) are a leading cause of death worldwide, including Europe [1, 2]. Ischemic heart disease and cerebrovascular disease have been the two leading causes of death in Greece during the past decade [2], mainly attributed to unfavorable changes in modifiable risk factors such as dyslipidemia [3]. Since the 1990s, accumulating and overwhelming evidence points to the detrimental effects of trans fatty acids (TFA) on human health, particularly with respect to cardiovascular health and total mortality [1, 4, 5, 6, 7].
Higher TFA intakes have been associated in general with a 20–30% increased
risk of all-cause mortality, irrespective of replacement nutrients [8]. TFA are
unsaturated fatty acids that contain at least one double bond in the trans
configuration and can be of natural origin or industrially produced. The latter
have been widely used in food manufacturing, such as bakery products and
margarine, due to their increased plasticity and chemical stability. TFA,
however, have been associated with adverse health effects, disrupting circulating
lipid biomarkers; specifically increasing LDL-cholesterol, lipoprotein (little) a
(Lp
Other to the direct effects of TFA’s to the cardiovascular system, they may also exert an indirect effect on it. Specifically, a linear association has been reported between higher TFA intake and increased weight gain and fat adiposity, as well as with impaired glucose tolerance [14, 15]. Based on the above adverse physiological effects, it has been reported that a 2% absolute energy intake from TFA is associated with a substantial increase in coronary heart disease (CHD) incidence, and specifically with 23% increase in CVD risk [16].
The World Health Organization (WHO) recommends that energy intake from TFA should not exceed 1%, including TFA of natural origin [17], and since 2015 it encourages TFA elimination in the food supply [18]. The European Food Safety Authority [19] also suggests that the intake of TFA should be as low as possible within the context of a nutritionally adequate diet. A study conducted between June 1995 and April 1996, assessed TFA intake in 14 Western European countries, one of which was Greece, and found that the population median of TFA consumption in Greece was among the lowest in Europe, ranging between 0.5% and 0.8% of total energy intake, for men and women respectively [20]. Since then a major transition has occurred towards a more Western type dietary pattern, with a simultaneous decreased adherence to a Mediterranean type diet [21]. Also, recently published [22] TFA concentration data of commonly consumed foods in Greece, indicated that certain foods can have TFA content exceeding 2% of total fat. It is therefore of great importance to acquire up-to-date information on total TFA intakes from a nationally representative sample of Greek adults.
Consequently, the aim of the present study was to conduct a TFA exposure assessment in Greek adults, identifying major contributing foods to this exposure and assess the association of TFA intake with likelihood of dyslipidemia and prevalence of other CVD risk factors, using a nationally representative sample.
This study included adults who were enrolled in the Hellenic National Nutrition
and Health Survey (HNNHS), a population-based survey conducted between September
2013 and May 2015. The study was designed to assess the health and nutritional
status of Greek residents, excluding individuals residing in institutions,
members of the armed forces, pregnant and lactating women, and individuals with
mental disabilities. Individuals were selected following a multi-stage stratified
sampling design, by geographical region, area, sex, and age group. Study details
have been published elsewhere [23]. A total of 3775 adults were enrolled in HNNHS
and a total of 3537 individuals
All individuals enrolled in the study were interviewed by trained personnel. An interviewer-administered questionnaire was used to obtain information on sociodemographics, anthropometric characteristics, medication intake, and lifestyle choices (such as smoking habits and level of physical activity).
Two 24 hr-recalls were collected; one during the first face-to-face interview, and the second through a telephone interview after 8–20 days on a different non-consecutive day, using the Automated Multiple Pass Method. For optimal intake assessment specific, validated food atlases and standardized household measures were used as portion anchors. The TFA content of the food groups used for this study was derived from two sources. The primary data source was the Nutrition Data System for Research (NDSR) developed by the University of Minnesota which is an integrated data system providing extended nutrient profile data [3] for globally consumed food. This system, however, does not contain ethnic consumed foods. Due to the high sensitivity requirements of TFA measurement, data from chemical analysis of 140 samples from different foods frequently consumed by the population residing in Greece, including fast food, pies and pastries, were used [22]. Details can be found in Appendix Table 3. To estimate the contribution of each food group (FG) to total TFA intake, foods reported in 24 hr were organized into 37FG’s, based on their composition (Appendix Table 4). Foods included in recipes/mixed dishes were assigned to multiple food groups according to the different foods that they consisted of and were then grouped as stated above.
The percentage of the contribution of each FG to TFA intake was derived by the following formula: % contribution of FG to TFA = (sum of TFA intake for that FG/sum of total TFA) * 100. This was calculated separately for each age and sex group. Total TFA intake (grams/day) was then transformed to total energy from TFA (TFA in grams * 9 kcal/per gram) and the latter was standardized by total mean energy consumption.
Data on total fat, SFA, Poly- and Mono- unsaturated fatty acids (PUFA & MUFA, respectively) and added sugars were also calculated as per total energy intake. Total fiber and cholesterol intake was measured in grams per day. Sodium from foods alone was also estimated and was reported in total grams per day.
Individuals with dyslipidemia were defined as those reported having high plasma
cholesterol and/or triglycerides levels, or on medication, or those who were
classified as dyslipidemic based on the European Society of Cardiology cut-offs
of lipid levels. These include (either/or): LDL-cholesterol
LDL = Total Cholesterol – HDL-cholesterol – (TG/5), in mg/dL
(Where TG, Triglycerides; HDL, High Density Lipoprotein; LDL, Low Density Lipoprotein.)
All blood samples were collected in the morning, between 8:00 and 10:00 AM, after fasting for at least 10 hours. All biochemical examinations listed above, as well as fasting plasma glucose were carried out using enzymatic methods in Cobas Integra 400 analyzer (F. Hoffmann-La Roche Ltd., Basel, Switzerland).
BP measurements were taken with individuals rested for at least 5 minutes,
seated with their back upright, and their arm well-supported at a 45
Sociodemographic and anthropometric data were collected by trained health
professionals using Computer Assisted Personal Interview (CAPI) software.
Specifics on age, sex and educational level were acquired by highly trained
health professionals. Educational level was classified into 3 groups:
Smoking habits and physical activity level were also assessed. Individuals were
classified as ex-smokers’ if they had stopped smoking at least for 30 days,
smokers, or never-smokers. Physical activity (PA) was defined as light, moderate
or high, according to the International Physical Activity Questionnaire (IPAQ),
as per calculation guidelines [26]. Individuals scoring below the light activity
level were categorized as sedentary. Weight (kg) and height (m) were measured
from which Body Mass Index (BMI) was derived [weight/height
Data were analyzed using appropriate methodology for survey design to have
generalizable results to the reference population. Specifically, data were
weighted by area, age group, and sex (as per sampling frame), using the 2011
Population Census. Continuous variables were presented as mean
The description of the main demographic, anthropometric dietary and other
personal characteristics is depicted in Table 1. Overall, TFA intake did not
differ by sex, age (in total and category), BMI, weight status and total energy
consumption. Median TFA intake was 0.53% as energy (0.34% to 0.81%) in the
total population but ranged from 0.27% in the first tertile to 0.95 in the 3rd,
with a significant increasing trend (p
| Variables | Tertile of Trans fatty acid intake | |||||
| Total Population N = 3537 | 1st Tertile N = 1163 | 2nd Tertile N = 1196 | 3rd Tertile N = 1178 | p for differences | p for trend | |
| Trans fatty acid intake, as % energy | 0.27 (0.1, 0.34) | 0.53 (0.47, 0.61) | 0.95 (0.81, 1.31) | |||
| Sex, % (95% CI) | ||||||
| Males | 48.7% | 50.4 (47.7, 53.1) | 47.2 (44.3, 50.2) | 47.4 (44.5, 50.2) | 0.26 | |
| Age in years, mean (sd) | 44.1 (18.5) | 42.9 (18.3) | 43.8 (19.1) | 0.202 | 0.499 | |
| Age category, % (95% CI) | 0.254 | |||||
| 18–39 years | 40.0 (45.1, 48.9) | 31.1 (28.7, 33.6) | 35.9 (33.5, 38.5) | 33.0 (30.6, 35.5) | ||
| 40–59 years | 32.1 (30.4, 33.9) | 37.3 (34.1, 40.6) | 30.0 (27.0, 33.1) | 32.7 (29.6, 36.0) | ||
| 20.9 (19.2, 22.7) | 31.3 (27.2, 35.8) | 32.1 (28.2 (36.3) | 36.5 (32.3, 41.1) | |||
| BMI (kg/m |
25.5 (4.7) | 25.6 (4.8) | 25.5 (4.8) | 25.3 (4.6) | 0.816 | 0.161 |
| BMI category, % (95% CI) | 0.176 | 0.358 | ||||
| Healthy weight | 88.2 (46.3, 50.1) | 47.8 (44.6, 51.1) | 37.2 (33.9, 40.4) | 15.1 (12.9, 17.6) | ||
| Overweight | 34.7 (32.9, 36.6) | 47.8 (44.7, 51.2) | 33.1 (30.1, 36.3) | 18.9 (16.4, 21.8) | ||
| Obesity | 17.1 (15.6, 18.7) | 48.8 (45.6, 52.1) | 33.9 (31.0, 37.0) | 17.3 (14.8, 20.0) | ||
| Total energy in kcals, mean (sd) | 1937 (859) | 1956 (904) | 1915 (817) | 1942 (856) | 0.022 | 0.501 |
| Total fat, % energy, mean (sd) | 38.1 (10.3) | 35.0 (11.9) | 38.1 (9.3) | 41.0 (8.7) | ||
| Trans fat, % energy, median, IQR | 0.53 (0.34, 0.81) | 0.27 (0.17, 0.34) | 0.53 (0.47, 0.61) | 0.95 (0.81, 1.31) | ||
| SFA, % energy, mean (sd) | 12.6 (4.3) | 10.1 (3.8) | 13.0 (3.6) | 14.6 (4.3) | ||
| PUFA, % energy, median IQR | 4.9 (3.9, 6.4) | 4.8 (3.7, 6.3) | 4.8 (3.8, 6.3) | 5.2 (4.1, 6.5) | ||
| MUFA, % energy, mean (sd) | 17.1 (6.1) | 16.9 (7.3) | 16.7 (5.6) | 17.6 (5.2) | 0.003 | |
| Added sugars, % energy, median IQR | 9.9 (4.9, 16.8) | 8.9 (3.9, 15.8) | 10.6 (5.3, 17.4) | 10.3 (5.6, 17.2) | 0.232 | |
| Fiber (gr), median IQR | 18.4 (12.1, 33.9) | 22.6 (13.9, 47.8) | 18.1 (12.3, 31.3) | 14.3 (6.1, 22.2) | ||
| Cholesterol (gr), median IQR | 203 (126, 313) | 162 (90, 274) | 202 (133, 305) | 238 (158, 360) | ||
| Total sodium (mg), mean (sd) | 2087 (738) | 1927 (737) | 2109 (702) | 2222 (746) | ||
| Total METS, median IQR | 2226 (984, 4986) | 2466 (990, 5280) | 2160 (942, 4746) | 2148 (990, 4764) | 0.242 | 0.201 |
| Smoking status, % (95% CI) | 0.633 | - | ||||
| Ex-smoker | 16.8 (15.4, 18.3) | 33.6 (29.2, 38.2) | 33.6 (29.4, 38.2) | 32.8 (28.5, 37.4) | ||
| Current smoker | 34.2 (32.3, 36.2) | 34.1 (31.0, 37.3) | 33.9 (30.8, 37.0) | 32.1 (29.1, 35.3) | ||
| Never smoker | 49.0 (47.0, 51.0) | 31.5 (28.9, 34.2) | 33.5 (31.0, 36.2) | 34.9 (32.3, 37.6) | ||
| Systolic BP in mmHg, mean | 118.6 (15.3) | 119.1 (14.4) | 117.3 (15.5) | 119.5 (15.8) | 0.754 | 0.804 |
| Diastolic BP in mmHg, mean | 72.0 (10.6) | 71.5 (10.8) | 72.1 (11.0) | 72.5 (10.0) | 0.422 | 0.276 |
| Dyslipidemia, % (95% CI) | 27.6 (26.0, 29.3) | 28.0 (23.3, 28.9) | 28.2 (25.4, 31.1) | 28.7 (25.8, 31.8) | 0.393 | - |
| Professional status, % (95% CI) | 0.232 | - | ||||
| Employed | 49.1 (47.1, 51.2) | 31.3 (28.7, 34.0) | 35.6 (32.9, 38.3) | 33.1 (30.6, 35.9) | ||
| Unemployed | 20.0 (18.5, 21.5) | 35.6 (31.7, 39.7) | 32.7 (29.0, 36.6) | 31.7 (28.0, 35.6) | ||
| Homeworkers | 7.7 (6.8, 8.7) | 33.9 (27.8, 40.5) | 28.4 (22.8, 34.9) | 37.7 (31.3, 44.5) | ||
| Pensioners | 23.2 (21.4, 25.0) | 32.4 (28.4, 36.6) | 32.2 (28.5, 36.2) | 35.4 (31.3, 39.7) | ||
| Educational Level in school years, % (95% CI) | 0.383 | - | ||||
| 14.9 (13.3, 16.6) | 36.0 (30.6, 41.7) | 31.5 (26.6, 36.8) | 32.5 (27.5, 38.0) | |||
| 35.9 (34.0, 37.8) | 33.9 (30.9, 37.1) | 32.9 (29.9, 36.0) | 33.2 (30.2, 36.4) | |||
| 49.2 (47.2, 51.3) | 30.9 (28.5, 33.5) | 34.9 (32.4, 37.3) | 34.2 (31.7, 36.8) | |||
| Marital status, % (95% CI) | ||||||
| Single/Divorced/Separated | 44.1 (42.1, 46.1) | 31.7 (29.1, 34.3) | 34.7 (32.1, 37.4) | 33.6 (31.1, 36.3) | 0.692 | - |
| Widowed | 7.5 (6.5, 8.7) | 32.5 (26.2, 39.4) | 30.6 (24.3, 37.7) | 36.9 (30.2, 44.2) | ||
| Married/Cohabitation agreement | 48.4 (46.3, 50.5) | 33.5 (30.6, 36.5) | 33.5 (30.8, 36.2) | 33.0 (30.2, 35.9) | ||
| All proportions are weighted by area, sex and age. Group differences were tested using chi square test for proportions, and ANOVA or Kruskal Wallis rank sum test for continuous data, depending on data distribution. p for trend was tested post hoc. | ||||||
In Fig. 1 the main food groups that contribute to TFA intake are depicted, including dairy and meat (poultry and red), in which TFA are found naturally. Cheese was by far the main contributor to TFA intake, with processed/refined grains and fried fish following.
 Fig. 1.
Main food group contribution to TFA in total population. The three most contributing food groups to TFA intake in adults in Greece are cheese, processed/refined grains such as pies/pastries and fried fish.
In Fig. 2 main food contributors by age group are presented, in this case excluding food groups with naturally occurring TFA’s. Although total TFA intake did not differ by age group, the weight of the major contributing foods highly differed. Specifically, processed refined grains (mainly from savory pastries & pies) and sweets were the main food contributors in younger adults, whereas fried fish clearly picked in older adults, with a 13% contribution in adults 71+ years and 18% in those between 51 and 70 years.
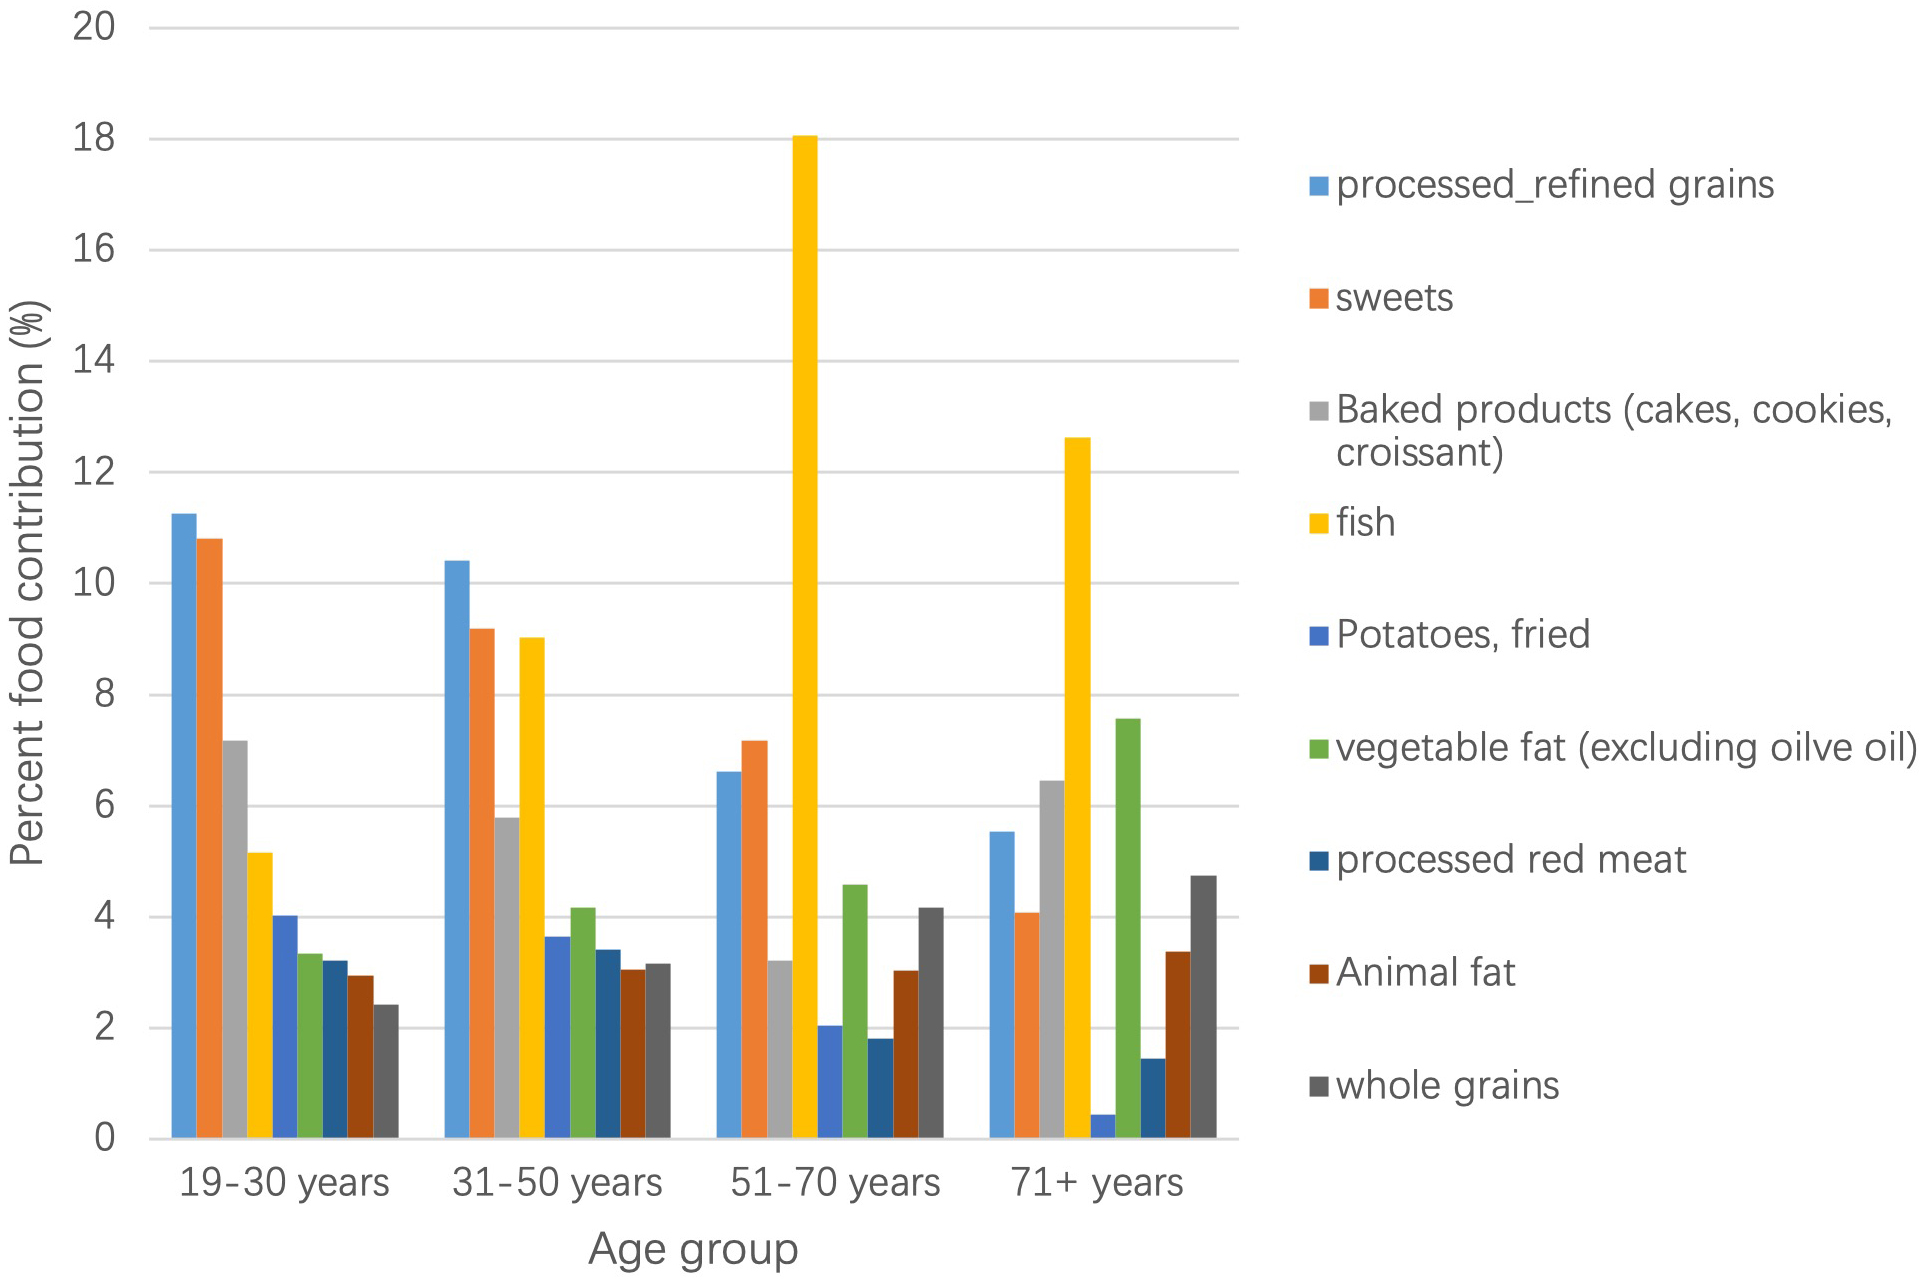 Fig. 2.
Main food group contribution to TFA by age group. The most contributing food group to TFA intake (excluding naturally ocurring TFA) for the age groups 19–30 y and 31–50 y was processed/refined grains, while for the age groups 51–70 y and 71+ y this was fried fish.
A descriptive presentation of the proportion of the population with specific CVD
risk factors among those consuming above the recommended levels of TFA intake
(
 Fig. 3.
Proportion of population with specific disease status that consume over
1% of total energy from trans-fat, in total and by sex (N = 577, 46.35% of
population). LDL, Low density Lipoprotein, all in md/dL.
Dyslipidemia as per measured abnormal lipid profile.
Hypercholesterolemia:
Dyslipidemia likelihood in total and by level of SFA intake is shown in Table 2.
A fully adjusted model, accounting for weight status saturated fat
intake, sex, age, smoking status, physical activity level (IPAQ), educational
level, and fiber intake, showed that dyslipidemia was 30% more likely for those
at the 2nd tertile or the 3rd tertile compared to the lowest intakes (OR: 1.3;
95% CI: 1.02–1.66 and 1.01–1.66, respectively). When the logistic regression
was stratified by SFA intake above and below recommended guidelines (10% of
total energy), the likelihood of dyslipidemia increased to 40%, (OR: 1.4; 95%
CI: 1.06–1.94). The results remained significantly higher only among those with
| Dyslipidemia | |||||||||
| Odds Ratio | Std. Err. | [95% Conf. Interval] | Odds Ratio | Std. Err. | [95% Conf. Interval] | Odds Ratio | Std. Err. | [95% Conf. Interval] | |
| Trans intake % energy 1st Tertile the reference level | |||||||||
| 2nd tertile | 1.3 | 0.2 | 1.02, 1.66 | 1.4 | 0.3 | 0.94, 2.22 | 1.3 | 0.2 | 0.97, 1.80 |
| 3rd tertile | 1.3 | 0.2 | 1.01, 1.66 | 0.8 | 0.2 | 0.49, 1.34 | 1.4 | 0.2 | 1.06, 1.94 |
| Weight status |
1.7 | 0.2 | 1.44, 2.11 | 2.0 | 0.4 | 1.38, 2.80 | 1.7 | 0.2 | 1.34, 2.11 |
| Sex |
1.1 | 0.1 | 0.87, 1.27 | 1.0 | 0.2 | 0.70, 1.40 | 1.1 | 0.1 | 0.85, 1.35 |
| Age category |
|||||||||
| 40–59 | 3.7 | 0.4 | 2.93, 4.51 | 5.0 | 1.1 | 3.23, 7.66 | 3.3 | 0.4 | 2.60, 4.29 |
| 5.4 | 0.9 | 3.70, 7.02 | 7.4 | 2.3 | 3.98, 13.72 | 4.6 | 0.9 | 3.20, 6.68 | |
| Smoking status |
|||||||||
| current | 0.8 | 0.1 | 0.66, 1.13 | 0.9 | 0.2 | 0.56, 1.52 | 0.9 | 0.1 | 0.62, 1.18 |
| never | 0.7 | 0.1 | 0.52, 0.86 | 0.8 | 0.2 | 0.47, 1.26 | 0.6 | 0.1 | 0.48, 0.85 |
| Physical activity level |
0.7 | 0.1 | 0.52, 0.81 | 0.5 | 0.1 | 0.35, 0.83 | 0.7 | 0.1 | 0.53, 0.88 |
| Educational level |
1.1 | 0.1 | 0.95, 1.30 | 1.2 | 0.2 | 0.88, 1.52 | 1.1 | 0.1 | 0.92, 1.32 |
| Total Saturated fat intake, % energy | 0.9 | 0.1 | 0.70, 1.11 | - | - | - | - | - | - |
| Sodium intake ( |
0.9 | 0.1 | 0.79, 1.05 | 1.0 | 0.1 | 0.74, 1.231 | 0.9 | 0.1 | 0.75, 1.07 |
| Total MUFA intake, % energy | 1.0 | 0.0 | 0.99, 1.02 | 1.0 | 0.0 | 0.99, 1.05 | 1.0 | 0.0 | 0.98, 1.02 |
| Reference categorization: MUFA, Monounsaturated fatty acids. | |||||||||
The present study showed that higher TFA intakes were significantly associated with an increased likelihood of dyslipidemia with prevalence of dyslipidemia reaching 63% among adults that consumed TFA above the recommended intake which is set to 1% of total energy intake. Also, although approximately 16% of the population exceeded the recommended levels of TFA intake, the median intake of the population at the highest tertile was 0.95% This means that approximately 1/3 of the population had an intake borderline to the recommended cut-off level. This proportion of the population also greatly exceeded SFA recommended intakes by 4.6%, a factor that showed to further increase likelihood of dyslipidemia by an additional 10%. The major food groups contributing to TFA intakes were a mix of natural and industrially produced TFA’s, with an emphasis on cheese, processed grains, fried fish, and baked goods & sweets. These results are in agreement with other studies [27] who reported a higher CVD risk with increasing TFA intakes and underline the need for public health prevention programs.
In 2020 WHO created a Certification Programme for Trans Fat Elimination in order
to recognize countries that have eliminated industrially produced TFA’s, with 14
countries, including USA, being recognized with best-practice and monitoring and
enforcement systems in place already in effect policies [18]. TFA’s can be of
natural (ruminant) origin (r-TFA) or industrially produced (i-TFA). Industrial
sources of TFA are mainly of concern, since the consumption of r-TFA on average
contributes to less than 0.5% of total energy intake [14]. Recently, the EU
Regulation 2019/649 (EC, 2019) set a limit of 2% i-TFA per 100 g of fat in
processed foods, in an effort towards further i-TFA reduction in the food supply
in the EU, a regulation fully implemented since April 2021. A reduction of i-TFA
intake has been a global public health priority. However, the question remains
whether a banning policy alone will effectively decrease CVD risk, since the
present study revealed that even levels close to but below 1% TFA intake with
respect to energy consumption are associated with increased likelihood of
dyslipidemia, especially among individuals that have SFA intakes
In the present study r-TFA’s were not distinguished from i-TFA’s since a recent
systematic review reported that both sources of TFA can increase cardiometabolic
risk parameters, especially lipid profile [6]. Specifically, although rTFA seems
to be less harmful than iTFA for HDL cholesterol, in the case of total
cholesterol and LDL cholesterol it may be worse. This is of great importance
considering that LDL is one of the strongest determinants of CVD risk and high
levels of LDL were found in 36.5% of this study’s population that consumed TFA
TFA’s are also present in baked and fried foods and significantly intake in the Greek population. Interestingly, results from the present representative study showed that apart from cheese, another major contributor to total TFA food was processed grains and their products and in particular baked goods such as savory and sweet pastries and pies.
Finally, the third major food which contributed highly to total TFA intake was fried fish, in all age groups, and primarily in adults over 50 years of age, indicating that the method of cooking could also significantly contribute to total TFA intake. This is of special interest since fish is a food that is perceived by most individuals as healthy and can be consumed in restaurants or at home. Since there are no available occurrence data on TFA content of fried fish prepared at home and/or out of home in Greece, these results should be viewed with caution and point to a need to focus on sampling fried fish, particularly from the catering sector, in future official food controls in Greece.
The results of this large, national cross-sectional study have been presented with caution due to the nature of the design and should be treated accordingly. Specifically, only the likelihood of outcomes can be evaluated with respect to specific risk factors, in this case dyslipidemia and level of TFA intake, and no temporal effects can be established. Other strong end points were not included, such as CVD outcomes since people tend to change their dietary and lifestyle habits after a specific event. This would have included systematic exposure measurement error in the analysis. The study however also has strong points, since it is a strategically designed study that aimed to evaluate the nutritional and health status using a national representative sample. Furthermore, TFA analysis was performed using country specific data, particularly for baked goods consumed, obtained during an official control program by the Hellenic Food Authority.
Dyslipidemia prevalence increased with higher total TFA intake, especially among those with high SFA intakes, underlining the need for stricter adherence to dietary guidelines following educational programs along with set public health policies. These are both highly modifiable factors and can greatly serve as vehicles to reduce dyslipidemia, a major cardiovascular risk factor. Both r-TFA and i-TFA should be monitored and further evaluated by level of SFA intake. Although i-TFA is expected to decrease following the implemented TFA elimination policy, monitoring the lipid profile of processed foods, particularly non-branded/non-prepackaged foods such as bakery foods and fried fish, and checking the abidance of the food and catering sector to the new EU legislation on i-TFA is necessary and important.
TFA, Trans Fatty Acids; Itfa, industrialized Trans Fatty Acids; rTFA, ruminant
Trans Fatty acids; PUFA, Polyunsaturated fatty Acids; MUFA, Mono unsaturated
Fatty acids; SFA, Saturated Fatty Acids; BMI, Body Mass Index; FG, Food groups;
HNNHS, Hellenic National Nutritiona and Helath Survey; EU, European Union; CVD,
Cardiovascular Diseae; CRP, C Reacive Protein; HDL, High Density Lipoprotein;
LDL, Low Density Lipoprotein; Lp
EM, GMa and AZ, designed the research study. EM, GMi, RM and AZ, performed the research. SK, AN, GMi, DP and RM provided help and advice on study methodology and statistical analyzis. EM, AN, SK and DP analyzed the data. EM, GMa and AZ wrote the manuscript. AN, DP and GMi significantly edited the manuscript. All authors contributed to other editorial changes in the manuscript. All authors read and approved the final manuscript.
All work was carried out upon obtaining individual consent and approval by the Ethics Committee of the Department of Food Science and Human Nutrition of the Agricultural University of Athens and by the Hellenic Data Protection Authority (HDPA) (MIS 374143).
Special thanks to all the fieldworkers.
The study was co-funded by Greece and the European Union (European Social Fund)
under the Operational Program “Human Resources Development 2007–2013” (project
code: 2012
The authors declare no conflicts of interest. Demosthenes Panagiotakos is serving as one of the Guest editors of this journal. We declare that Demosthenes Panagiotakos had no involvement in the peer review of this article and has no access to information regarding its peer review. Full responsibility for the editorial process for this article was delegated to Grant N. Pierce.
TFA Content of Foods
Food items sampled and analyzed are shown in Table 3. The mean TFA from multiple measurements was calculated and used for ethnically consumed food.
The TFA was recalculated for 5557 out of 87953 food consumed by the HNNHS sample. representing a percentage of 6.3% and for 97 out of 1915 unique foods (5.1%).
| Food Groups | Samples analyzed | HNNHS (n) | HNNS unique foods list (n) | TFA g/100 g food | i-TFA g/100 g food | ||
| Savoury (i.e., non-sweet) foods and snacks | 70 | 2703 | 39 | ||||
| Cheese pies | 30 | 712 | 6 | 0.58 | 0.49 | ||
| Cheese pies kaseropita | 2 | 14 | 2 | 0.87 | 0.72 | ||
| Spinach pies | 5 | 235 | 4 | 0.09 | 0.09 | ||
| Sausage pies | 5 | 67 | 3 | 0.43 | 0.40 | ||
| Pizza | 12 | 451 | 3 | 0.16 | 0.01 | ||
| Pizza tomato. cheese margarita | 4 | 55 | 2 | 0.21 | 0.04 | ||
| Meat products | 10 | 1094 | 15 | ||||
| Pork skewers | 3 | 265 | 3 | 0.05 | 0.05 | ||
| Pork gyros | 3 | 201 | 4 | 0.09 | 0.09 | ||
| Chicken gyros | 1 | 88 | 3 | 0.11 | 0.11 | ||
| Βurger (no bread) bifteki | 1 | 498 | 1 | 0.08 | 0.08 | ||
| Kebab | 2 | 42 | 4 | 0.26 | 0.18 | ||
| French Fries | 5 | 44 | 7 | 0.05 | 0.05 | ||
| Pop corn | 3 | 100 | 1 | 0.12 | 0.12 | ||
| Dessert/sweet foods and snacks | 70 | 2854 | 58 | ||||
| Cakes | 20 | 608 | 21 | 0.09 | 0.07 | ||
| Cakes | 10 | 531 | 15 | ||||
| Cake vanilla-chocolate/cocoa | 2 | 22 | 1 | 0.08 | 0.08 | ||
| Cake cocoa | 2 | 23 | 1 | 0.05 | 0.05 | ||
| Gateaux type layer cakes | 10 | 77 | 6 | 0.2 | 0.00 | ||
| Gateaux cake almond | 2 | 6 | 1 | 0.172 | 0.00 | ||
| Gateaux cake vanilla-chocolate | 2 | 9 | 1 | 0.322 | 0.00 | ||
| Gateaux cake chocolate | 1 | 33 | 1 | 0.28 | 0.00 | ||
| Cookies/biscuits | 15 | 1113 | 15 | ||||
| Cookies | 10 | 940 | 12 | 0.23 | 0.13 | ||
| Butter cookies | 1 | 55 | 1 | 0.21 | 0.00 | ||
| Cinnamon cookies | 2 | 58 | 1 | 0.07 | 0.03 | ||
| Grape must cookies | 1 | 79 | 1 | 0.08 | 0.08 | ||
| Chocolate/cocoa cookies | 1 | 41 | 1 | 0.11 | 0.10 | ||
| Biscuits | 5 | 173 | 3 | 0.07 | 0.07 | ||
| Stuffed biscuits | 4 | 169 | 1 | 0.08 | 0.08 | ||
| Croissants | 10 | 382 | 8 | 0.18 | 0.07 | ||
| Doughnuts | 10 | 112 | 2 | ||||
| Doughnuts Loukoumas | 5 | 53 | 1 | 0.07 | 0.04 | ||
| Doughnuts Donuts | 5 | 59 | 1 | 0.08 | 0.08 | ||
| Sweet Pastries (Bougatsa)) | 5 | 54 | 1 | 0.48 | 0.47 | ||
| Wafers | 5 | 104 | 3 | 0.61 | 0.59 | ||
| Ice creams | 5 | 481 | 8 | 0.13 | 0.01 | ||
| Ice cream parfait | 1 | 9 | 1 | 0.14 | 0.00 | ||
| Sum | 140 | 5557 | 97 | ||||
| Food Groups | ||
| Fruits | Egg | Artificially-sweetened beverages |
| Fresh fruits, cooked or dried | Eggs | Carbonated artificially-sweetened beverages |
| Fruit juice, 100% | Fish and Shellfish | Salty snacks |
| Natural fruit juices unsweetened | Fish fresh and frozen | Chips, crackers, pop corn |
| Non-starchy vegetables | Shellfish | Desserts and Sweets |
| Green leafy vegetables | Red meat | Sweets, candy, chocolate |
| Tomatoes, carrots, lettuce | Lamb, pork, veal, game | Milk desserts |
| Mixed and other vegetables | White meat | Sugary foods (i.e., baklavas) |
| Vegetable juice | Poultry | Condiments and spices |
| Starchy vegetables | Processed meat | Salt all types |
| Corn, beans, green beans | Sausages, ham, salami, beacon of red meat origin | Water from mixed recipes |
| Pumpkin | Processed white meat | Water natural, mineral and carbonated |
| Sweet potatoes | Sausages of white meat origin | Coffee |
| Potato | Chicken nuggets | Tea |
| Potatoes | Processed fish | Artificially sweeteners |
| Wholegrain cereals | Smoked, caned and salted fish | Sugar |
| Wholegrain cereal products | Fish sticks | Sugar, honey, syrup |
| Processed cereals | Olive oil and olives | Baked products |
| All refined grains and cereal products | Olive oils | Cake, biscuit, pie, muffin, doughnuts |
| Legumes | Oils | Artificially sweetened Fruit juices |
| Legumes, (i.e., beans) | Vegetable fat | Artificially sweetened fruit juices |
| Meat alternatives, soy, tofu | Vegetable oils, vegetable fat, vegetable oil-based salad dressing | Baby food |
| Nuts | Animal fat | Baby food |
| Nuts, almonds, seeds | Butter, mayonnaise | |
| Peanut butter | White sauce, cream | |
| Almond milk | Alcoholic beverages | |
| Milk | Alcoholic beverages | |
| Milk and milk drinks | Sugar-sweetened beverages | |
| Yogurt | Carbonated and non-carbonated sugar-sweetened beverages | |
| Yogurt | ||
| Cheese |