
- Academic Editor
Background: Various electrocardiographic (ECG) abnormalities are associated with the severity of pulmonary thromboembolism (PTE). The utility of evaluating the clot burden of PTE based on ECG findings alone has yet to be thoroughly investigated in Chinese patients. The aim of this study was therefore to use ECG signs to establish novel models for quantitative and localization analysis of clot burden in patients with acute PTE. Methods: Acute PTE patients from three centers were enrolled between 2015 and 2019 in a retrospective cohort study (NCT03802929). We analyzed the 12-lead ECGs at admission and studied computed tomography pulmonary angiography (CTPA) features to obtain the Qanadli score of clot burden and location of thrombus. Novel risk prediction models were developed and validated using derivation and external validation cohorts, respectively. Results: A total of 341 acute PTE patients were screened, of whom 246 (72.1%) were from Shanghai Tenth People’s Hospital, 71 (20.8%) were from Shanghai Pulmonary Hospital and 24 (7.0%) were from Qidong People’s Hospital. In the derivation cohort, predictors included in the final models were congestive heart failure, chronic obstructive pulmonary disease, hypertension, coronary heart disease, atrial fibrillation and ECG abnormalities. The CHARIS (COPD/CHF/CHD, HTN, Atrial arrhythmias/AF, RBBB/RAD, Inverted T wave and S1Q3T3/ Sinus tachycardia) I model was established for quantitatively assessing Qanadli score. It had moderate discrimination in both the derivation cohort (concordance index (c-index) of 0.720, 95% CI 0.655–0.780) and the validation cohort (c-index of 0.663, 95% CI 0.559–0.757). The CHARIS II model was used to predict the probability of trunk obstruction. It showed similar discrimination in the derivation cohort (c-index of 0.753, 95% CI 0.691–0.811) and in the validation cohort (c-index of 0.741, 95% CI 0.641–0.827). Calibration curves and Hosmer-Lemeshow test confirmed the accuracy of the risk prediction equations in the external validation dataset. Decision curve analysis showed the CHARIS I and CHARIS II algorithms had positive net benefits in both the derivation and validation cohorts. Conclusions: From quantitative and localization perspectives, the CHARIS algorithms can identify acute PTE patients with heavy thrombus burdens prior to imaging diagnosis. Clinical Trial Registration: NCT03802929, https://www.clinicaltrials.gov/study/NCT03802929.
Acute pulmonary thromboembolism (APTE) is the third most frequent cause of cardiovascular morbidity and mortality after acute coronary syndrome and stroke. With improvements in diagnostic modalities and physician awareness, the inpatient mortality of APTE in China decreased progressively from 25.1% in 1997 to 8.7% in 2008 [1]. The clinical presentations of APTE varies, ranging from asymptomatic and incidentally discovered emboli, to massive embolism causing sudden death prior to diagnosis. In Europe, 34% of pulmonary thromboembolism (PTE) patients suffer immediate death, 59% remain undiagnosed until death, and only 7% having a definitive diagnosis before death [2]. Hence, timely diagnosis of PTE and screening out massive PTE can be challenging, and the overall mortality from massive pulmonary embolism (PE) remains as high as 52% [3].
Electrocardiographic (ECG) changes are increasingly reported as being useful for assessing the severity of PE, while also showing a strong correlation with hemodynamic collapse of right ventricular dysfunction [4, 5, 6, 7, 8, 9, 10]. So far, there is a notable absence of ECG in the clinical tools available for prognostication of PE in the guidelines. To address this, Daniel et al. [11] reported an ECG scoring system in 2001 that could predict the severity of pulmonary artery hypertension (PAH) in PTE and the degree of perfusion defect on ventilation-perfusion lung scanning. However, few Chinese studies have so far evaluated the utility of ECG abnormalities for assessing clot burden, hemodynamic status, right ventricular function, survival rates and management of patients presenting with acute PTE. The initial aim of this study was therefore to develop a revised scoring system that could predict the severity of acute PTE (localization and quantification) on the basis of ECG abnormalities. This should assist clinicians when screening patients who present with massive PTE prior to imaging diagnosis.
This study was registered with the American Clinical Trials Registry Center (https://clinicaltrials.gov; Registration number NCT03802929) and approved by our institutional review board. Informed consent was obtained from all participants or their families.
We conducted a multicenter retrospective cohort study involving consecutive
inpatients with confirmed APTE. The three hospitals were the Shanghai Tenth
People’s Hospital, the Shanghai Pulmonary Hospital, and the Qidong People’s
Hospital. Eligibility for this study required patients to be
The final selected research subjects were divided into derivation and validation groups according to the different thrombosis centers. The derivation cohort consisted of 246 acute PTE patients hospitalized at Shanghai Tenth People’s Hospital, China, between April 2015 and December 2019. The external validation cohort consisted of 95 acute PTE patients recruited from Shanghai Pulmonary Hospital, China (n = 71) and Qidong People’s Hospital, China (n = 24), also between December 2015 and December 2019.
We retrospectively analyzed 12-conductive ECG performance of all selected patients when acute PTE was confirmed. ECGs were recorded using a standard voltage of 1 mV/10 mm and a paper passing speed of 25 mm/s. ECG changes were independently analyzed by an ECG doctor and a cardiologist. Six common ECG manifestations associated with the prognosis of PTE were evaluated in this study: (1) typical S1Q3T3 signs, (2) sinus tachycardia, (3) complete/incomplete right bundle branch block (RBBB), (4) right axis deviation (RAD), (5) atrial arrhythmias, (6) V1–V3 T wave inversion (TWI) (Table 1).
| ECG changes | Definition |
ECG, electrocardiographic; APTE, acute pulmonary thromboembolism; RBBB, right bundle branch block.
All selected subjects in this study underwent MCTPA. The examination was
performed by a technician accompanied by a clinician, and the report was
independently reviewed by at least two radiologists. MCTPA images were used to
obtain thrombus positions for locative assessment of clot burden (Fig. 1A–C),
while the Qanandli score was calculated for the quantitation of clot burden. The
arterial tree of each lung is regarded as having 10 segmental pulmonary arteries
(PAs) (three to the upper lobes, two to the middle lobe or lingula, and five to
the lower lobes). Qanadli score =
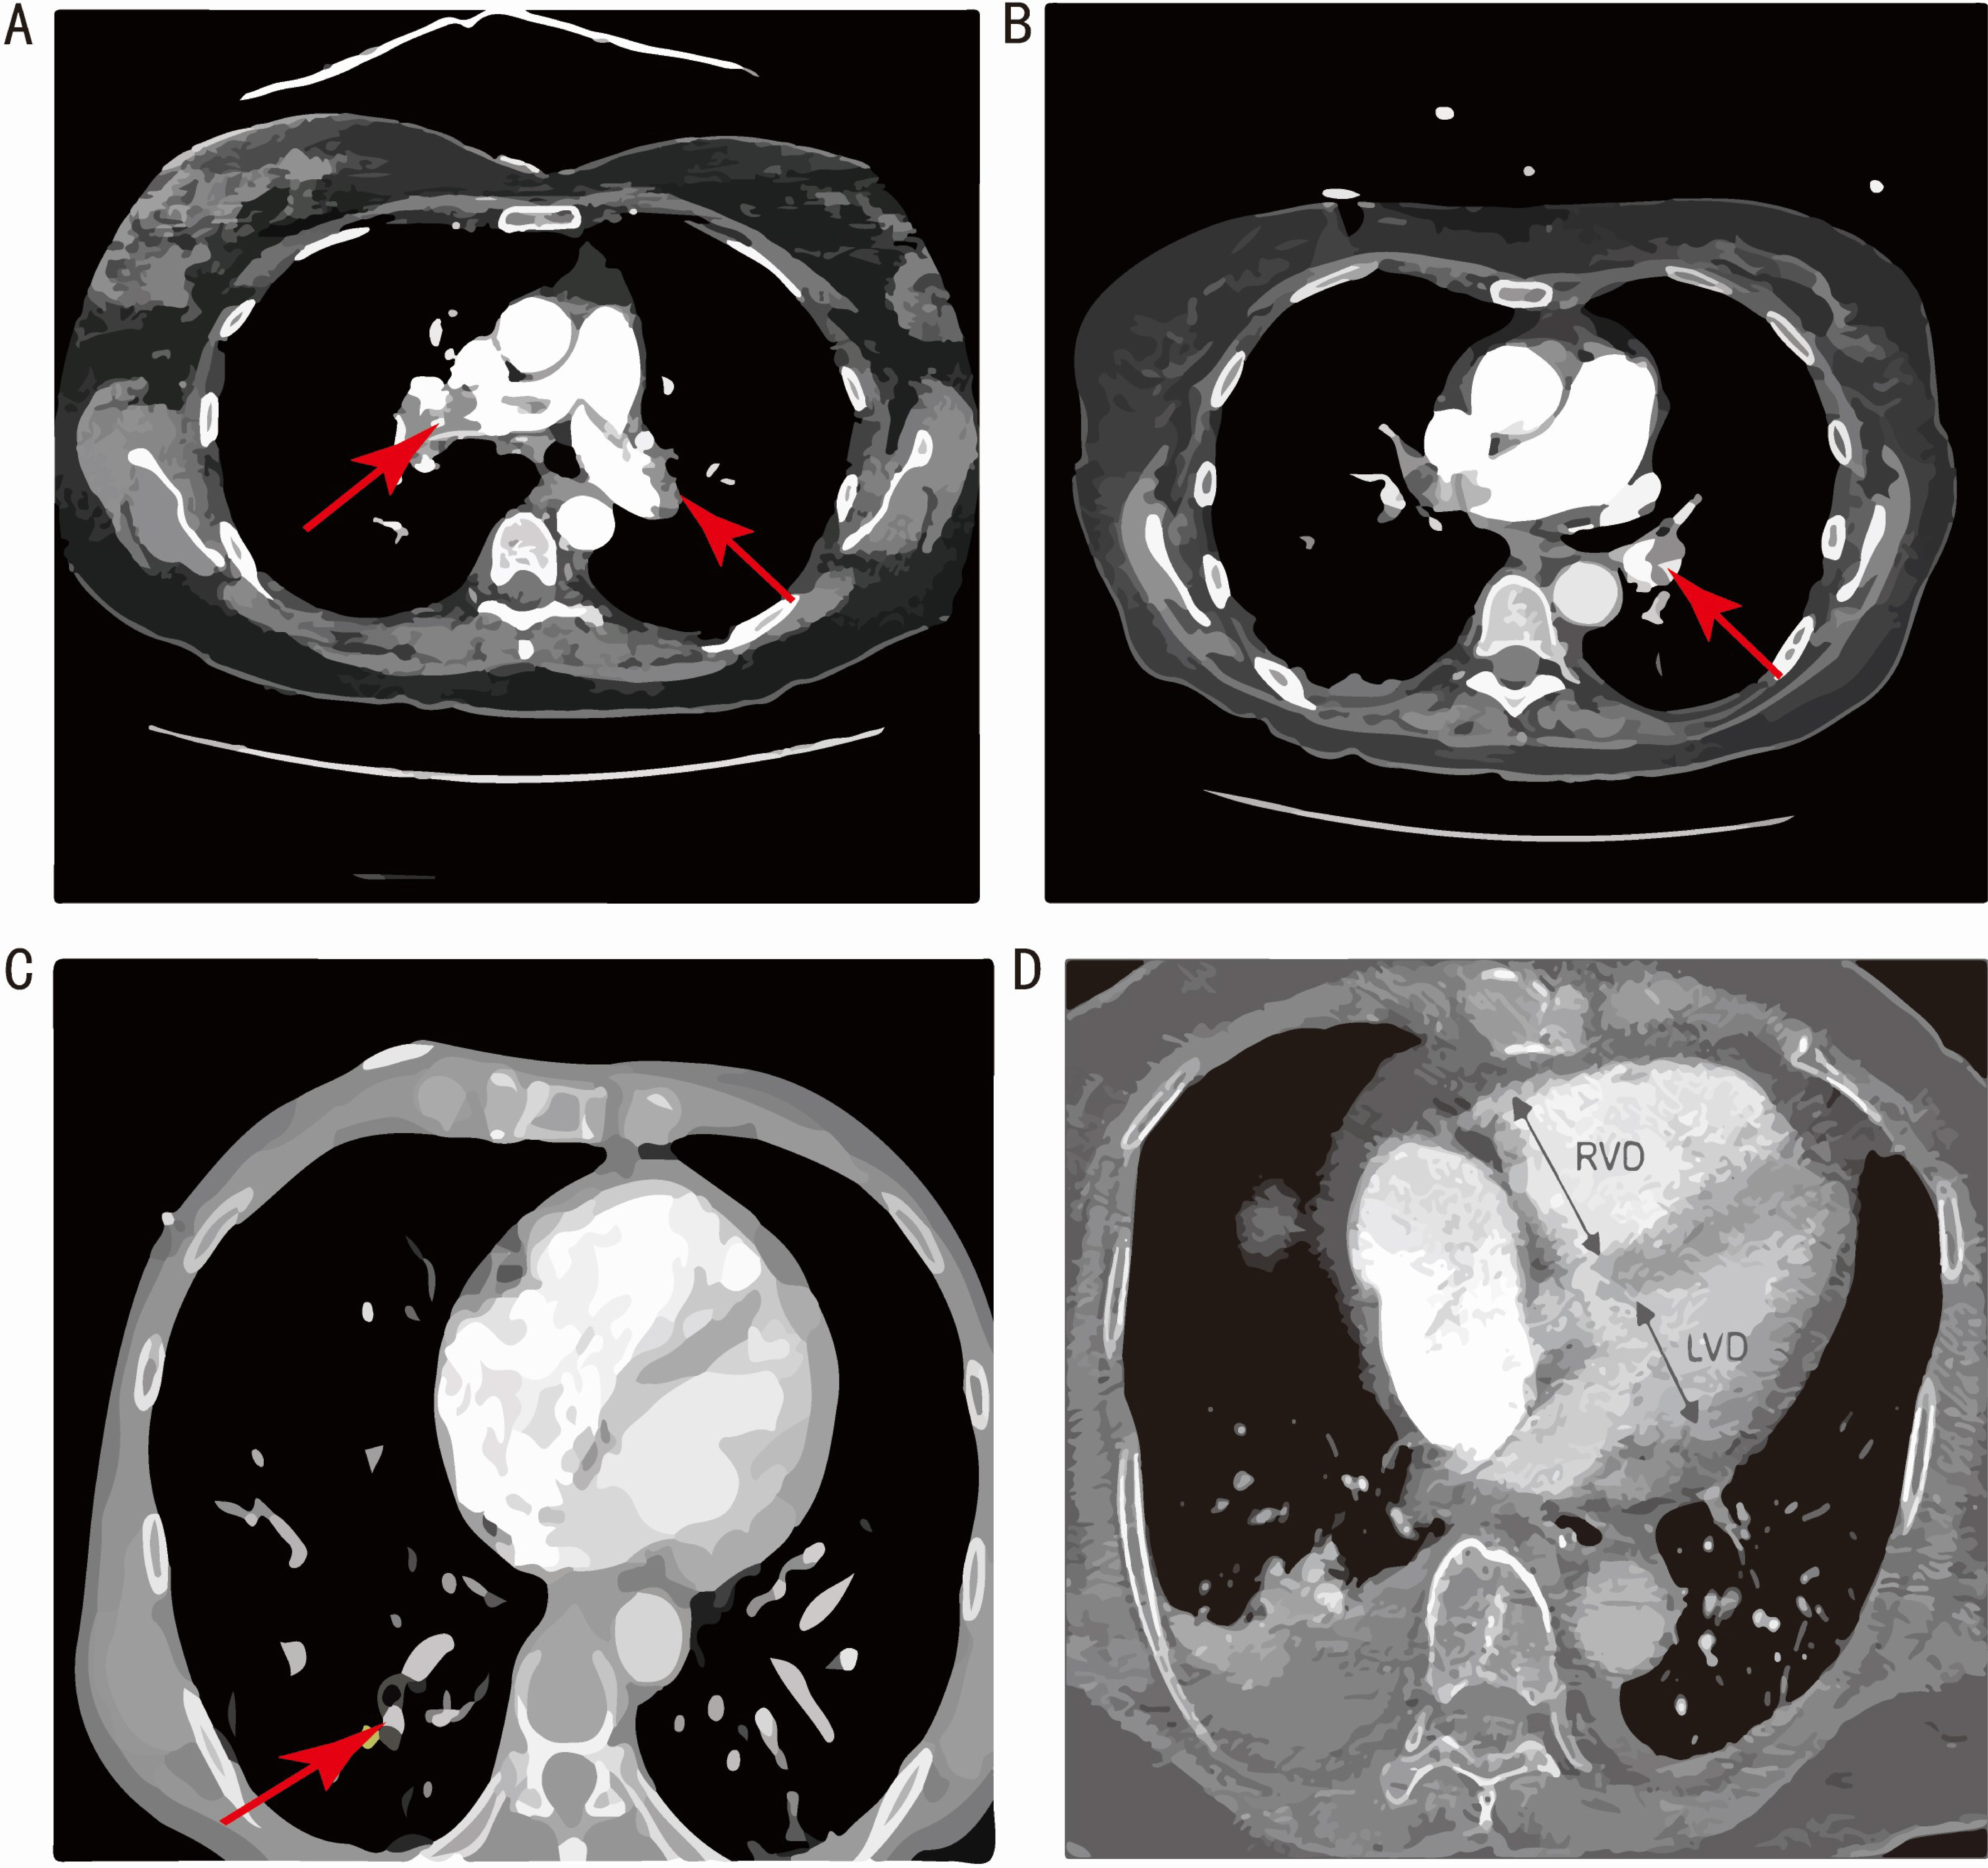 Fig. 1.
MCTPA images demonstrating thrombus in different parts of the pulmonary artery (PA). (A) large saddle embolus at the bifurcation of the main pulmonary artery. (B) Blood clot in the lobar branch of PA. (C) Blood clot in the segmental branch of PA. (D) MCTPA illustration of RV/LV diameter ratio measurement on a four-chamber CT image. RVD, right ventricular dysfunction; LVD, left ventricular dysfunction; MCTPA, multidetector computed tomography pulmonary angiography; RV, right ventricle; LV, left ventricle; CT, computerized tomography.
For each patient, information was extracted on sociodemographic and lifestyle characteristics, pre-existing comorbidities, hematological parameters, ECG performance, and imaging examination results from medical records. ECG changes and comorbidities affecting ECG performance were selected as candidate predictors based on an extensive literature review. These comorbidities included chronic obstructive pulmonary disease (COPD), hypertension (HTN), coronary heart disease (CHD), congestive heart failure (CHF), atrial fibrillation (AF).
All analyses were performed with Stata 15.0 (Statacorp LLC, College Station, TX, USA).
Continuous variables with normal distribution were presented as mean
Overall, 393 consecutive patients with acute PTE were screened for eligibility. Of these, 22 (5.6%) patients were excluded because they did not have a technically adequate MCTPA according to the established criteria. Of the remaining 371 patients, 30 were excluded to pregnancy (n = 3, 0.8%) or missing medical information (n = 27, 6.9%), leaving 341 eligible patients enrolled in the study. The subjects were assigned to either the derivation group or validation group according to the hospital at which they were treated (Fig. 2).
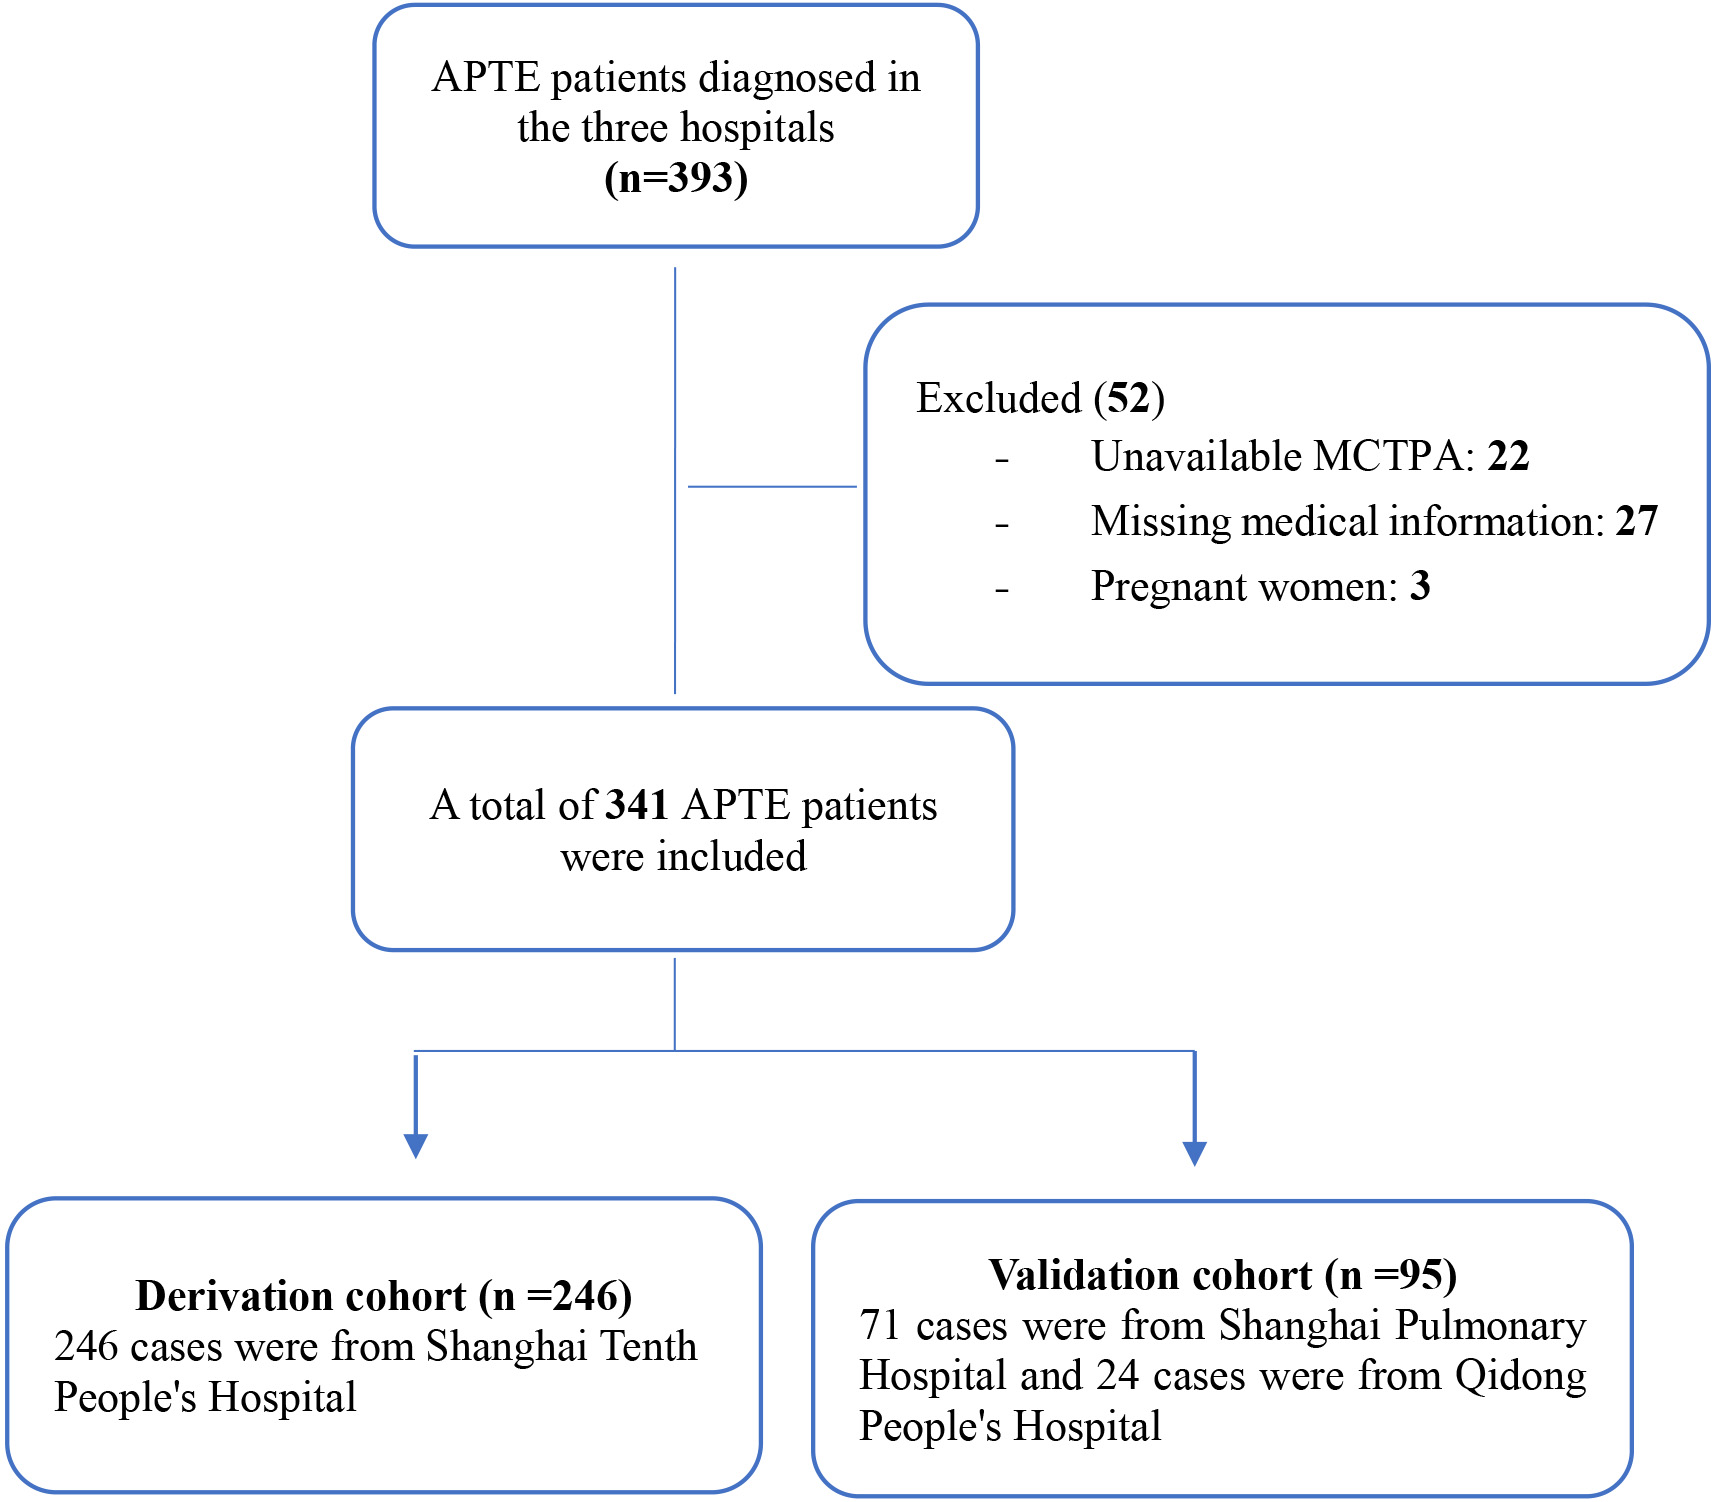 Fig. 2.
Patient flow diagram. APTE, acute pulmonary thromboembolism; MCTPA, multidetector computed tomography pulmonary angiography.
The general characteristics of the two groups are listed in Table 2. In the
derivation group (n = 246), 128 patients (52%) were males and the average age
was 72 (
| Variables | Derivation cohort | Validation cohort | |
| n = 246 | n = 95 | ||
| Gender (male) (%, n) | 52.0 [128] | 46.3 [44] | |
| Age (years) | 72 |
61 | |
| BMI (kg/m |
24.1 |
25.1 | |
| SBP (mmHg) | 137 |
134 | |
| DBP (mmHg) | 81 |
78 | |
| Heart rate (bpm) | 90 |
91 | |
| SPO |
95 |
95 | |
| Comorbidities | |||
| COPD (yes) (%, n) | 22.4 [55] | 18.9 [18] | |
| Hypertension (yes) (%, n) | 58.1 [143] | 46.3 [44] | |
| Diabetes mellitus (yes) (%, n) | 20.3 [50] | 11.6 [11] | |
| CHD (yes) (%, n) | 17.5 [43] | 17.9 [17] | |
| CHF (yes) (%, n) | 10.2 [25] | 13.7 [13] | |
| Atrial fibrillation (yes) (%, n) | 9.8 [24] | 7.4 [7] | |
| Stroke (yes) (%, n) | 18.7 [46] | 8.4 [8] | |
| Cancer (yes) (%, n) | 16.7 [41] | 13.7 [13] | |
| Laboratory parameters | |||
| WBCs (×10 |
8.1 |
8.5 | |
| Hemoglobin (g/L) | 122 |
130 | |
| Platelets (×10 |
214 |
216 | |
| ALT (u/L) median (25th–75th percentiles) | 25.4 [14.1, 40.0] | 27.0 [15.0, 46.0] | |
| AST (u/L) | 26.0 [18.9, 39.6] | 25.0 [18.0, 38.0] | |
| Serum creatine (µmol/L) | 80.2 |
66.2 | |
| BUN (mmol/L) | 6.9 |
6.3 | |
| UA (µmol/L) | 321 |
340 | |
| CRP (mg/L) | 15.8 [4.9, 54.3] | 13.6 [3.2, 23.3] | |
| cTnT (ng/mL) | 0.017 [0.009, 0.042] | 0.028 [0.015, 0.054] | |
| cTnI (ng/mL) | 0.006 [0.003, 0.012] | ||
| CK-MB (ng/mL) | 1.88 [1.18, 3.67] | 3.26 [2.00, 5.30] | |
| NT-proBNP (pg/mL) | 426 [107, 1419] | 321 [40, 882] | |
| D-dimer (mg/L) | 5.07 [2.25, 8.27] | 1.6 [0.68, 6.2] | |
| Electrocardiogram | |||
| S1Q3T3 signs (%, n) | 6.5 [16] | 14.7 [14] | |
| Sinus tachycardia (%, n) | 17.1 [42] | 22.1 [21] | |
| RBBB (%, n) | 12.2 [30] | 10.5 [10] | |
| Incomplete RBBB (%, n) | 6.5 [16] | 8.4 [8] | |
| Complete RBBB (%, n) | 5.7 [14] | 2.1 [2] | |
| Right axis deviation (%, n) | 2.4 [6] | 5.3 [5] | |
| Atrial arrhythmias (%, n) | 17.1 [42] | 14.7 [14] | |
| V1–V3 TWI (%, n) | 12.2 [30] | 13.7 [13] | |
| Thrombus position | |||
| Trunk (%, n) | 23.2 [57] | 42.1 [40] | |
| Bilateral trunk (%, n) | 11.4 [28] | 25.3 [24] | |
| Left main PA (%, n) | 3.3 [8] | 2.1 [2] | |
| Right main PA (%, n) | 8.5 [21] | 14.7 [14] | |
| Lobar PA (%, n) | 24.0 [59] | 26.3 [25] | |
| Segmental PA (%, n) | 48.0 [118] | 29.5 [28] | |
| Qanadli score (%) | 27.5 |
42.0 | |
| [0–25%] (%, n) | 59.8 [147] | 47.4 [45] | |
| [25%–50%] (%, n) | 24.4 [60] | 18.9 [18] | |
| [50%–75%] (%, n) | 9.3 [23] | 15.8 [15] | |
| [75%–100%] (%, n) | 3.7 [9] | 17.9 [17] | |
| RV short axis diameter* (mm) | 36.0 |
38.0 | |
| LV short axis diameter* (mm) | 44.0 |
42.0 | |
| RV/LV diameter ratio | 0.84 |
0.91 | |
Definition of abbreviations: BMI, body mass index; SBP, systolic blood
pressure; DBP, diastolic blood pressure; COPD, chronic obstructive pulmonary
disease; CHD, coronary heart disease; CHF, congestive heart failure; WBCs, white
blood cells; ALT, alanine aminotransferase; AST, aspartate aminotransferase; BUN,
blood urea nitrogen; UA, uric acid; CRP, c-reactive protein; RBBB,
right bundle branch block; TWI, T wave inversion; PA, pulmonary
artery; RV, left ventricular; LV, right ventricular; NT-proBNP, N-terminal pro-B-type natriuretic peptide; CK-MB,
creatine kinase and its MB isoenzyme; cTnT, cardiac troponin-T; cTnI, cardiac troponin I; MCTPA, multidetector computed tomography pulmonary angiography;
SPO
*detected by MCTPA.
In the derivation group, analysis of the ECG recordings on admission showed the presence of typical S1Q3T3 signs in 16 patients (6.5%), sinus tachycardia in 42 patients (17.1%), incomplete RBBB in 16 patients (6.5%), complete RBBB in 14 patients (5.7%), RAD in 6 patients (2.4%), atrial arrhythmias in 42 patients (17.1%) and V1–V3 TWI in 30 patients (12.2%). In the validation group, the most frequently observed abnormality was sinus tachycardia (n = 21, 22.1%), followed by incomplete atrial arrhythmias (n = 14, 14.7%), typical S1Q3T3 signs (n = 14, 14.7%), V1–V3 TWI (n = 13, 13.7%), incomplete RBBB (n = 8, 8.4%), RAD (n = 5, 5.3%) and complete RBBB (n = 2, 2.1%).
Among the 246 patients in the derivation group, 57 (23.2%) had thrombus in the
left and/or right main PA, 59 (24%) in the lobar branches of PA and 118 (48.0%)
in the segmental or subsegmental branches of PA. The mean Qanadli score in the
derivation group was 27.5 (
The ECG abnormalities of S1Q3T3 signs (44.1% vs 26.9%, p = 0.015), sinus tachycardia (40.7% vs 25.0%, p = 0.004) and RAD (47.1% vs 26.8%, p = 0.05) were significantly associated with the Qanadli score. Although the Qanadli score was higher in patients with V1–V3 TWI (33.1% vs 27.2%, p = 0.270) on ECG, the difference was not statistically significant. The Qanadli score was lower in patients with either atrial arrhythmia (24.4% vs 28.2%, p = 0.416) or with RBBB (19.3% vs 29.4%, p = 0.661) on ECG, but neither of these differences was statistically significant (Fig. 3).
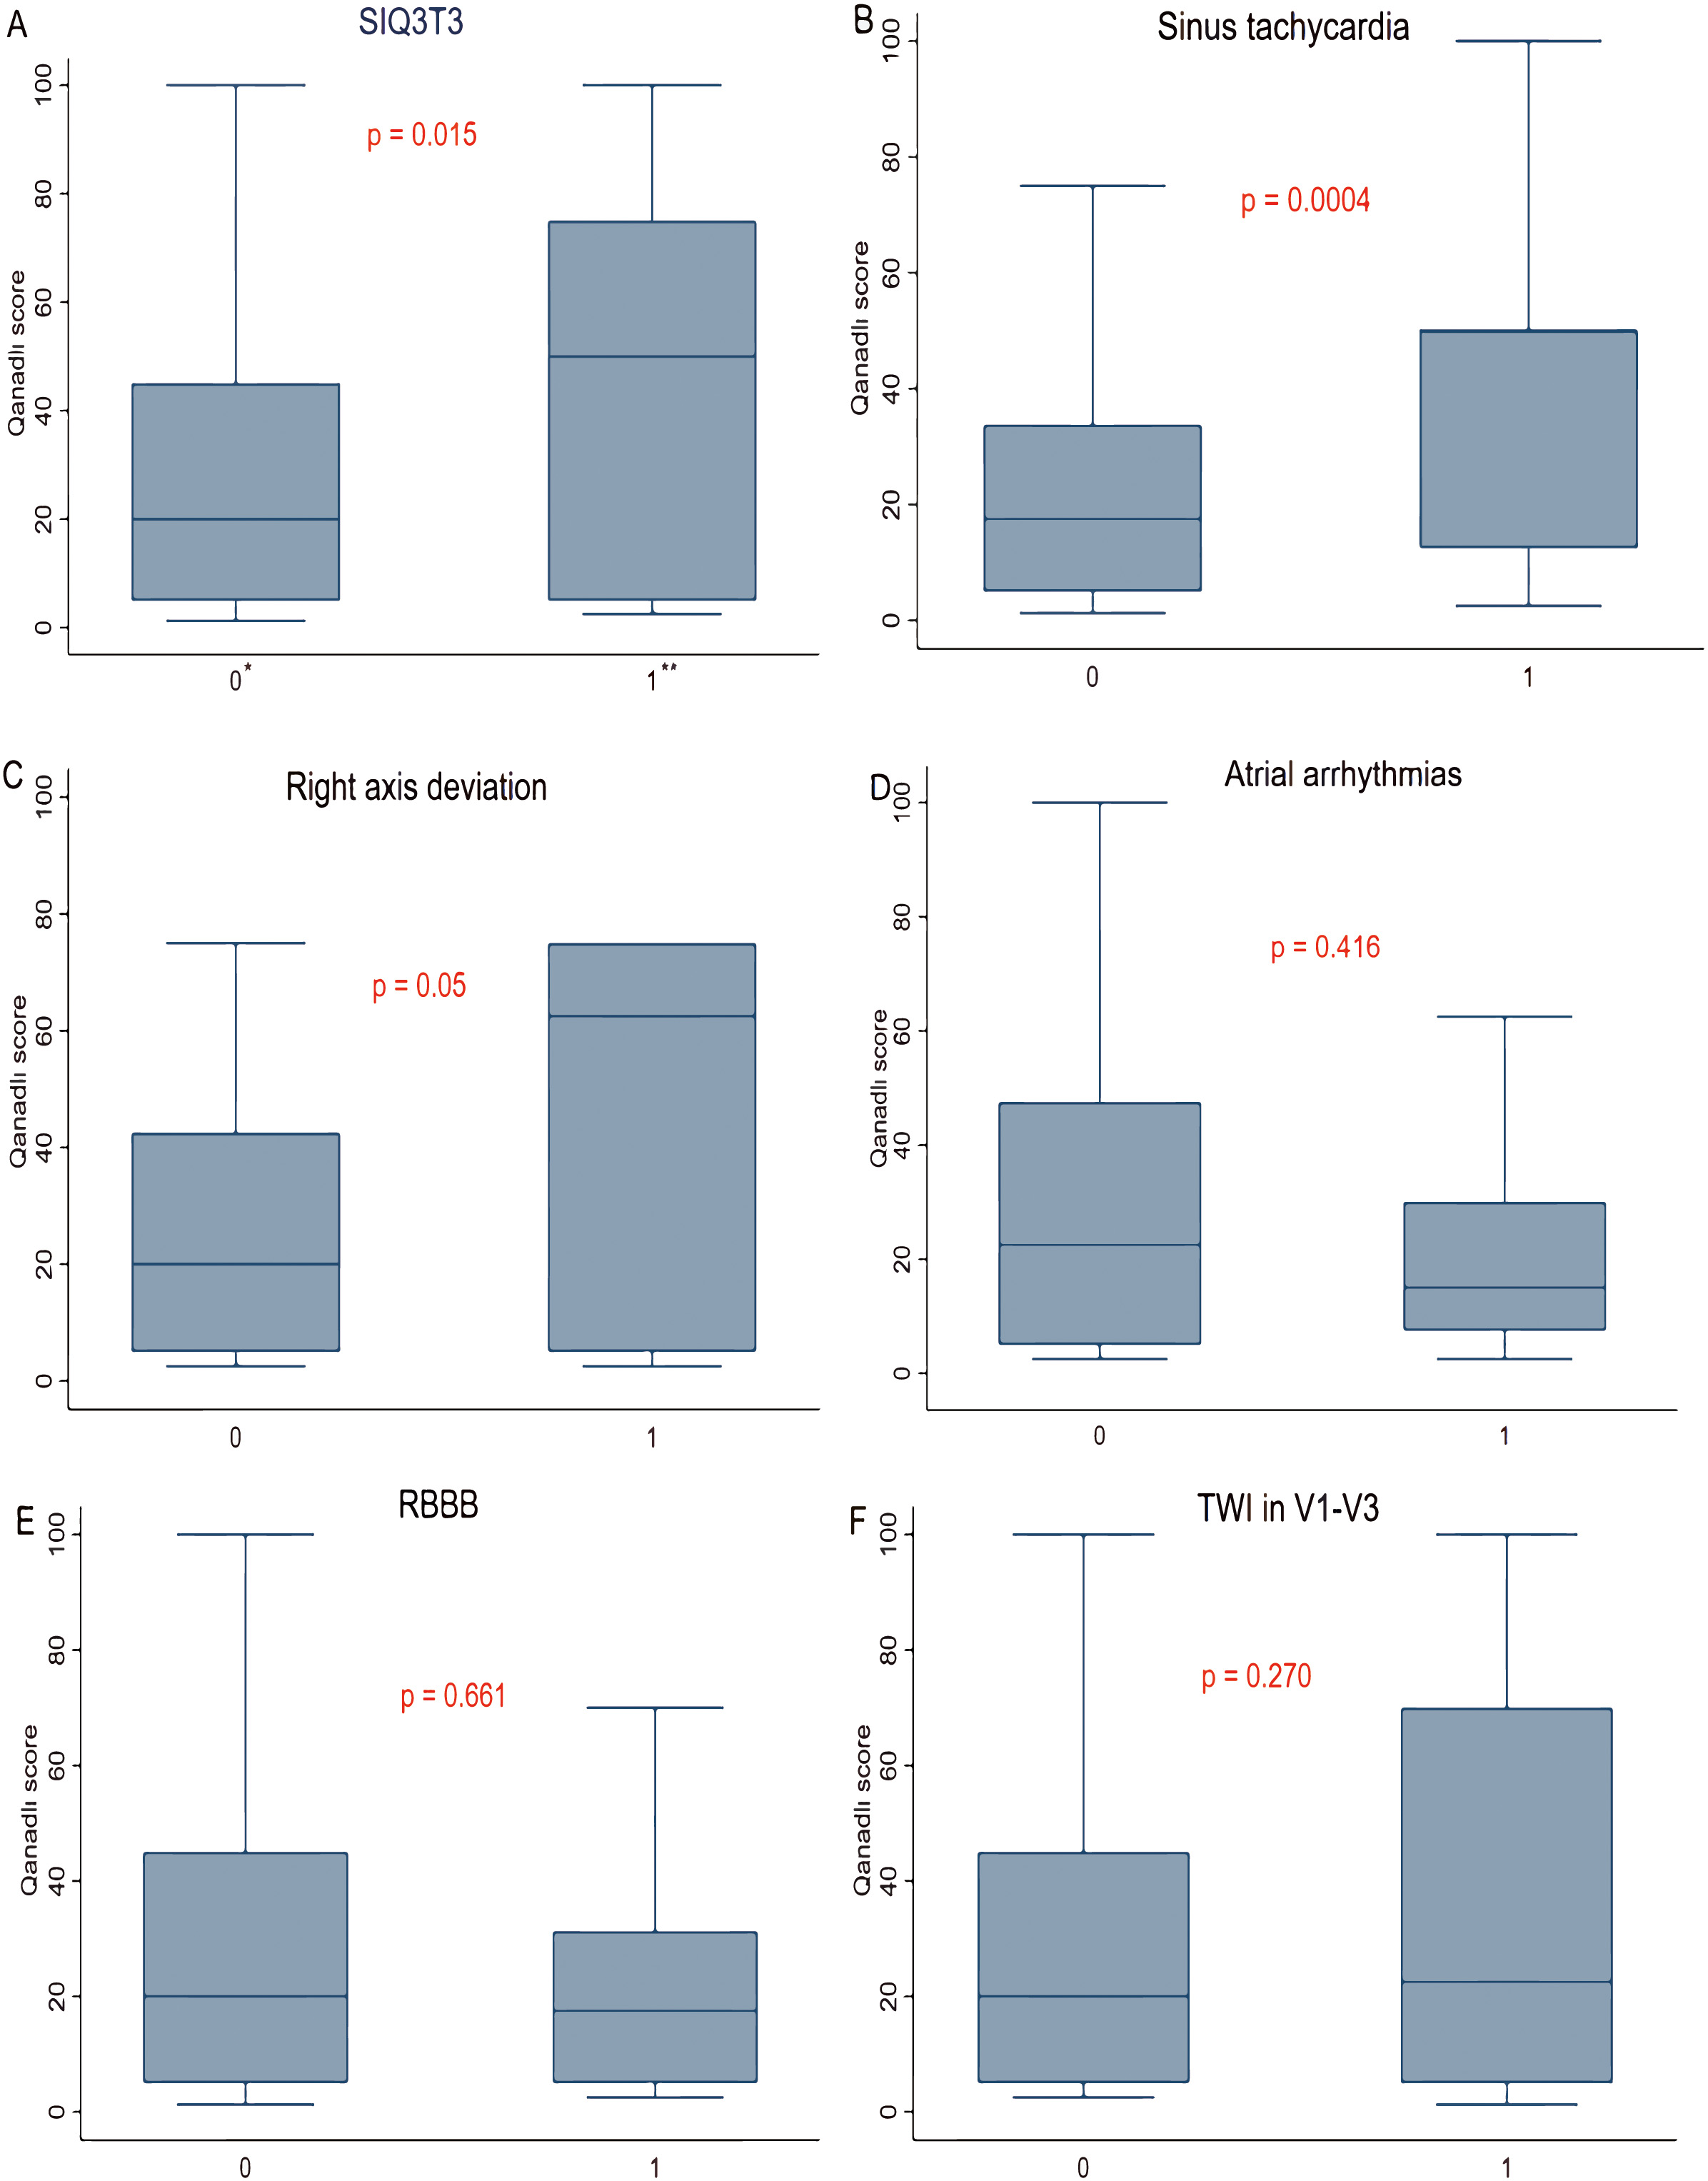 Fig. 3.
Correlation between electrocardiogram abnormalities and Qanadli
score. (A) Association between the S1Q3T3 pattern and Qanadli score. (B)
Association between sinus tachycardia and Qanadli score. (C) Association between
right axis deviation and Qanadli score. (D) Association between atrial
arrhythmias and Qanadli score. (E) Association between RBBB and Qanadli score.
(F) Association between TWI in V1–V3 and Qanadli score. RBBB, right bundle branch
block; TWI, T wave inversion. *absent = 0; **present = 1. p
The distribution of ECG changes and thrombus sites are shown in Table 3.
Univariable analyses revealed that acute PTE patients with S1Q3T3 signs
(p
| ECG changes | Location of thrombus | p | ||
| Main PA | Lobar PA | Segmental PA | ||
| S1Q3T3 | 7 [50.0%] | 3 [21.4%] | 4 [28.6%] | |
| Sinus tachycardia | 19 [46.3%] | 10 [24.4%] | 12 [29.3%] | |
| RBBB | 4 [13.3%] | 6 [20.0%] | 20 [66.7] | 0.202 |
| Right axis deviation | 3 [50.0%] | 0 | 3 [50.0%] | 0.027* |
| Atrial arrhythmias | 4 [10.5%] | 12 [31.6%] | 22 [57.9%] | 0.218 |
| TWI in V1–V3 | 9 [33.3%] | 5 [18.5%] | 13 [48.1%] | 0.406 |
Definition of abbreviations: PA, pulmonary artery; RBBB, right bundle branch block; TWI, T wave inversion; ECG, electrocardiograph.
* p
The derivation dataset was used to create a ROC curve between Qanadli score and
RVD detected by MCTPA. The best cut-off value obtained was 25% (70.6%, 63.9%)
(Fig. 4A). To identify patients with a massive burden of thrombus, we used
Qanadli score
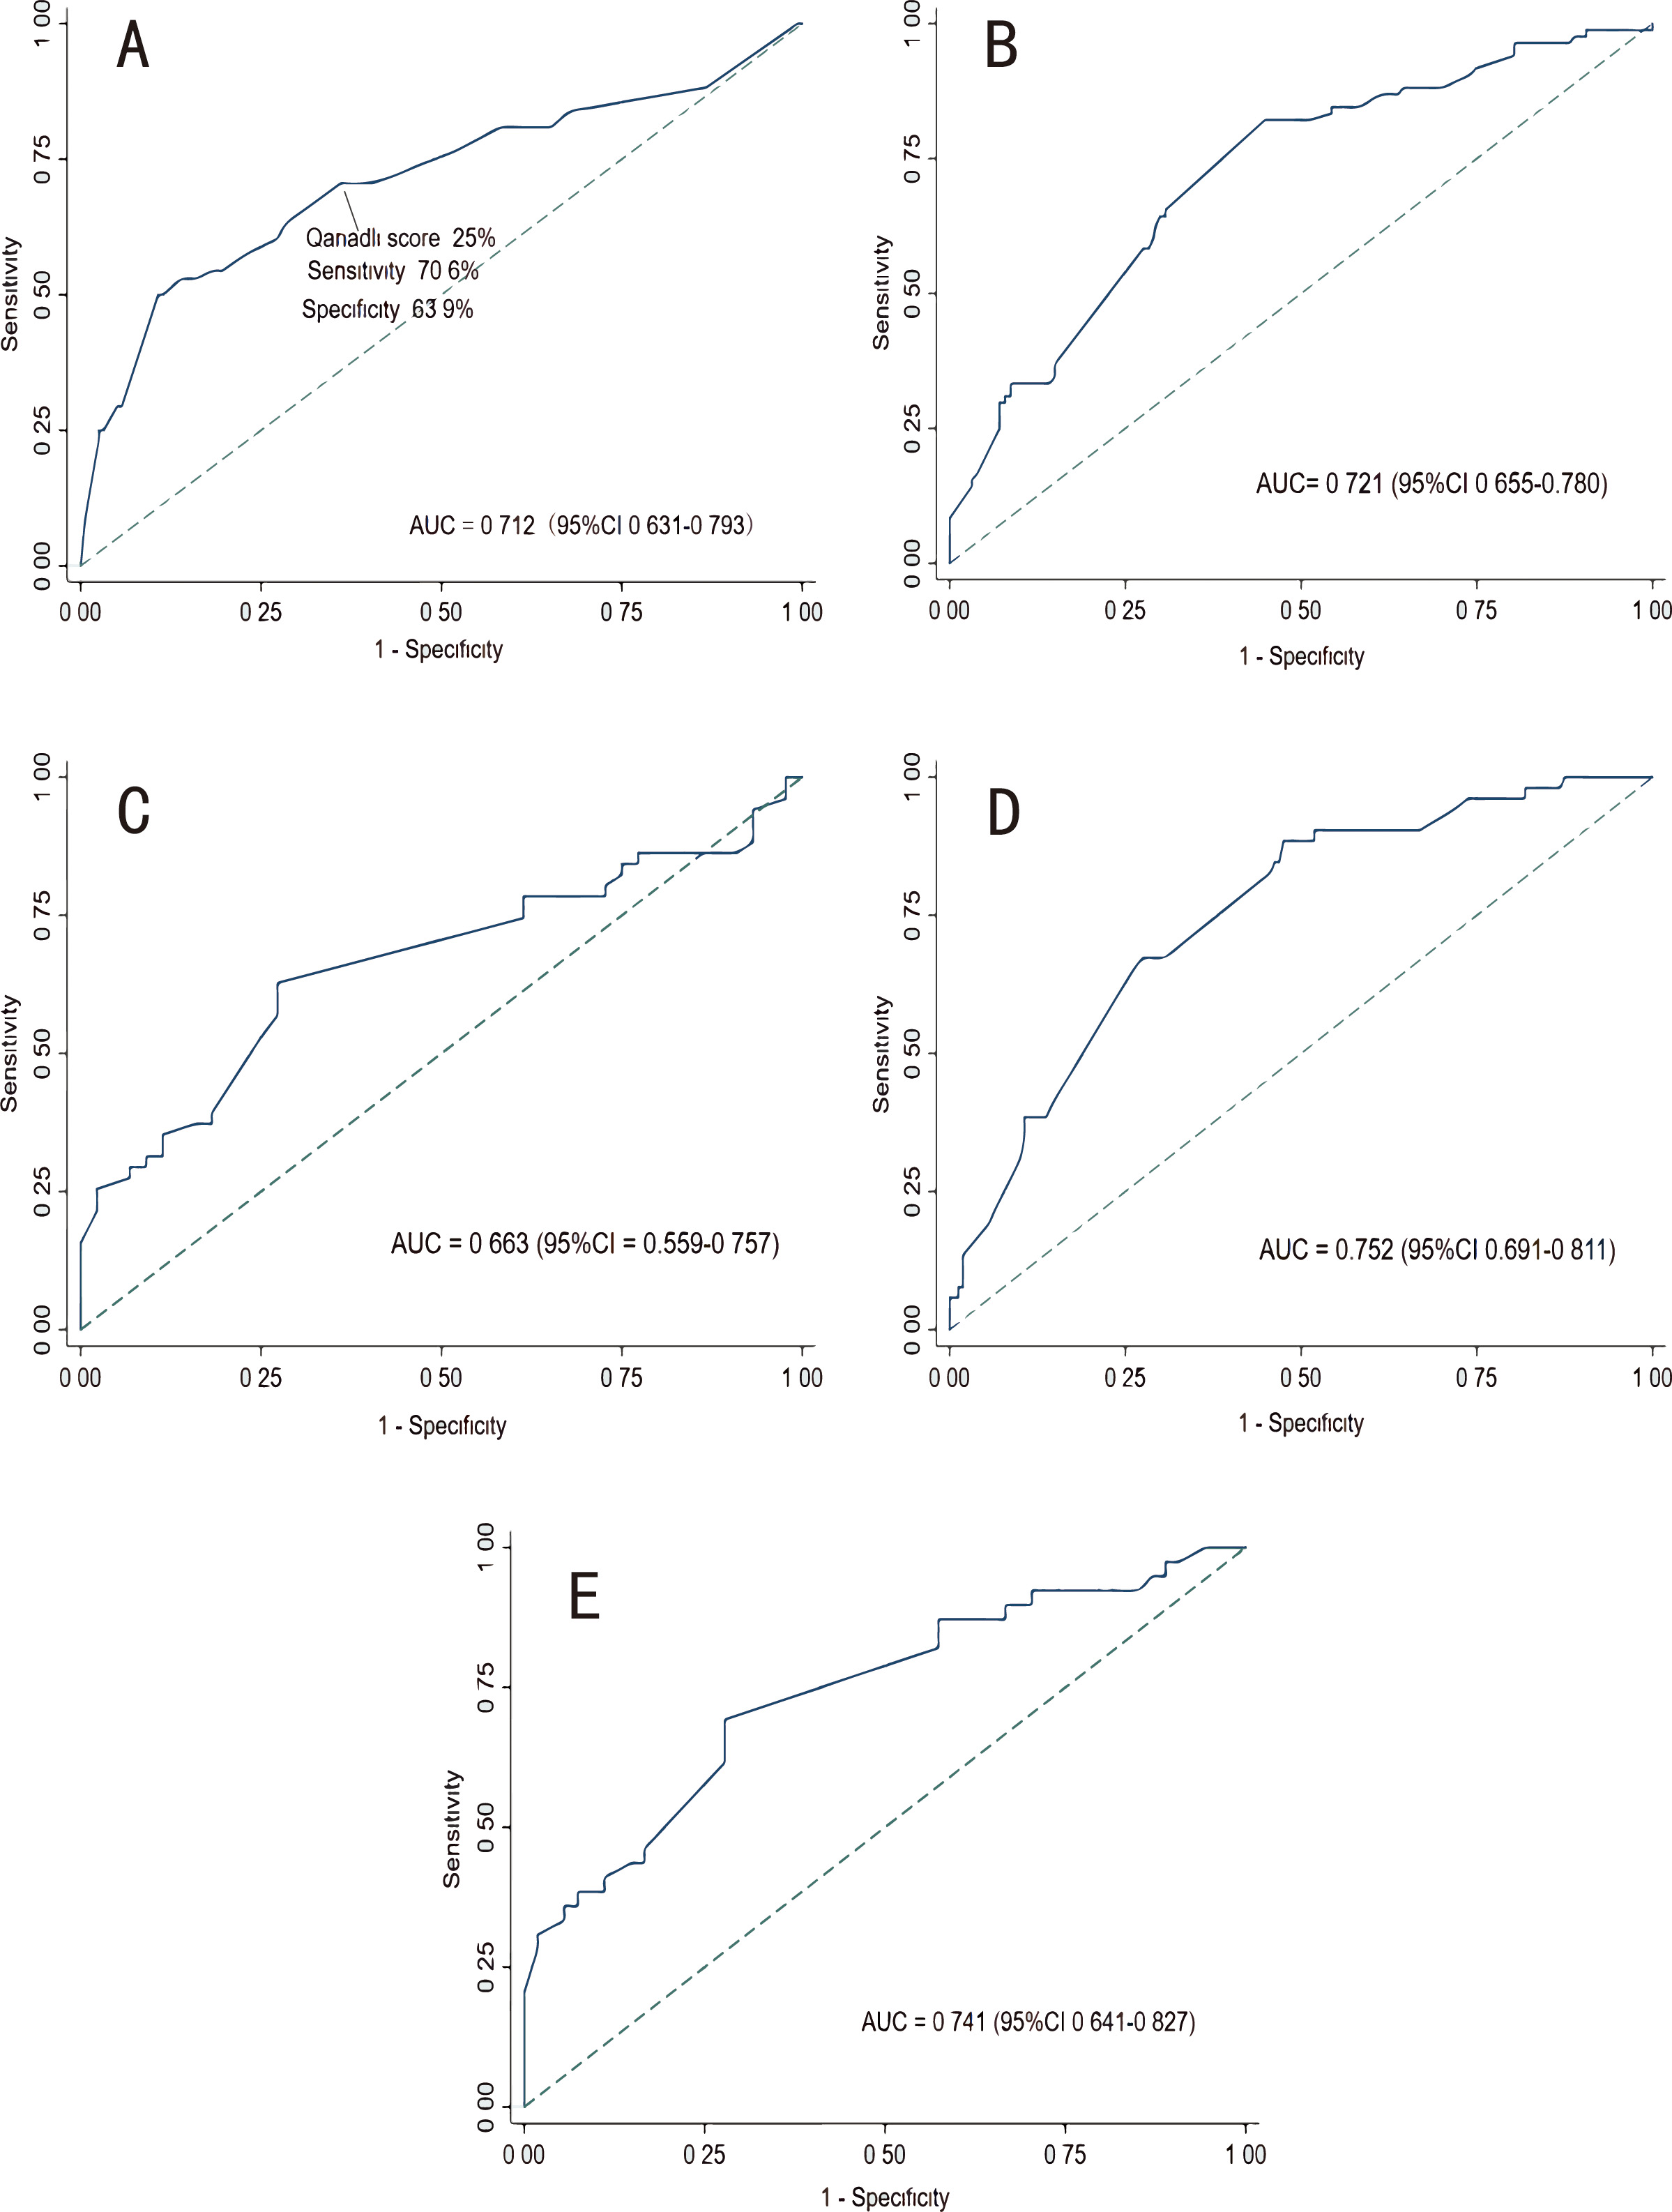 Fig. 4.
Receiver operating characteristic curves. (A) ROC curve for Qanadli score to predict right ventricular dysfunction. (B) ROC of CHARIS I model in the derivation cohort. (C) ROC of CHARIS I model in the external validation cohort. (D) ROC of CHARIS II model in the derivation cohort. (E) ROC of CHARIS II model in the external validation cohort. ROC, receiver operating characteristic curve; AUC, area under the curve; CHARIS, COPD/CHF/CHD, HTN, Atrial arrhythmias/AF, RBBB/RAD, Inverted T wave and S1Q3T3/ Sinus tachycardia.
These new prediction models were given the acronym CHARIS (COPD/CHF/CHD, HTN, Atrial arrhythmias/AF, RBBB/RAD, Inverted T wave and S1Q3T3/ Sinus tachycardia).
The final risk equation, referred to here as the CHARIS I
model (p
Probability of Qanadli score
(Each factor in the equation is assigned a value of “0” if it is absent, and a value of “1” if it is present).
Similarly, we took thrombus in the main PA as the dependent variable and entered
the same predictors as above into a binary logistic regression model to establish
CHARIS II algorithm (p
Probability of thrombus in the main PA = 1 / 1 + e
(Each factor in the equation is assigned a value of “0” if it is absent, and a value of “1” if it is present).
To assess the performance of the CHARIS prognostication models, we applied the algorithms to both the derivation data set and the external validation data set.
According to the ROC curves in Fig. 4, the CHARIS I model had good discriminative performance with an internally validated c-index of 0.721 (95% CI 0.655–0.780) and an externally validated c-index of 0.663 (95% CI 0.559–0.757). The AUC for CHARIS II model to distinguish thrombus in the main PA from thrombus in branch PA was 0.752 (95% CI 0.691–0.811) in the derivation set, while the c-index in the external validation set was 0.741 (95% CI 0.641–0.827).
To further characterize the performance of
accuracy, a calibration plot and the Hosmer-Lemeshow
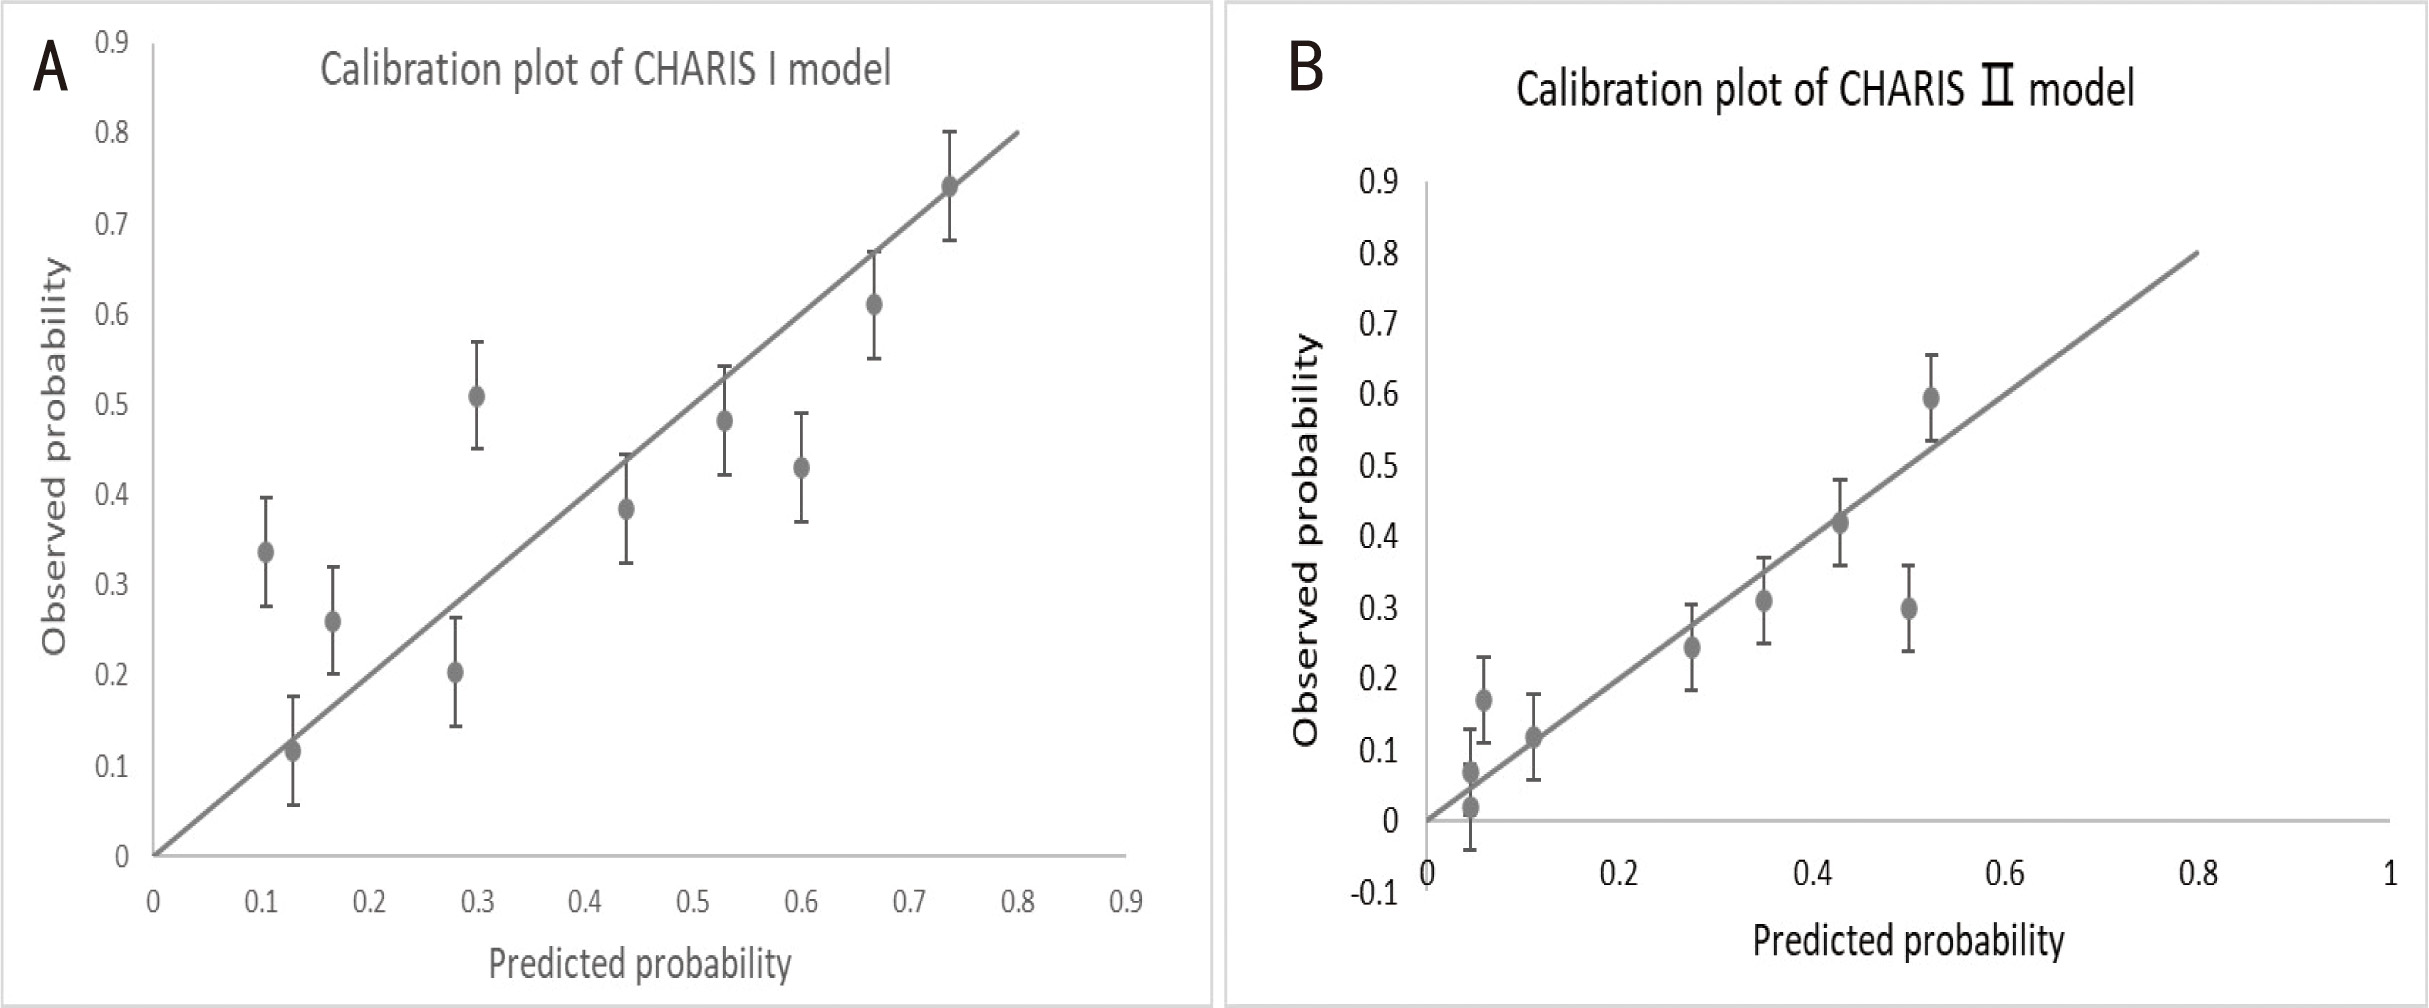 Fig. 5.
Assessing calibration of the two models in the external
validation cohort. (A) Calibration plot of CHARIS I model with p-value
for H-L test = 0.428 (p
Finally, we carried out a decision curve analysis to evaluate the clinical utility of the novel models (Fig. 6). The CHARIS I model showed a positive net benefit across a broad range of risk thresholds from 20% to 90% in the derivation group and from 40% to 90% in the validation group. The CHARIS II model displayed consistent positive results and had a large net benefit at a threshold probability ranging from 10% to 90% in the derivation group and from 30% to 90% in the validation group.
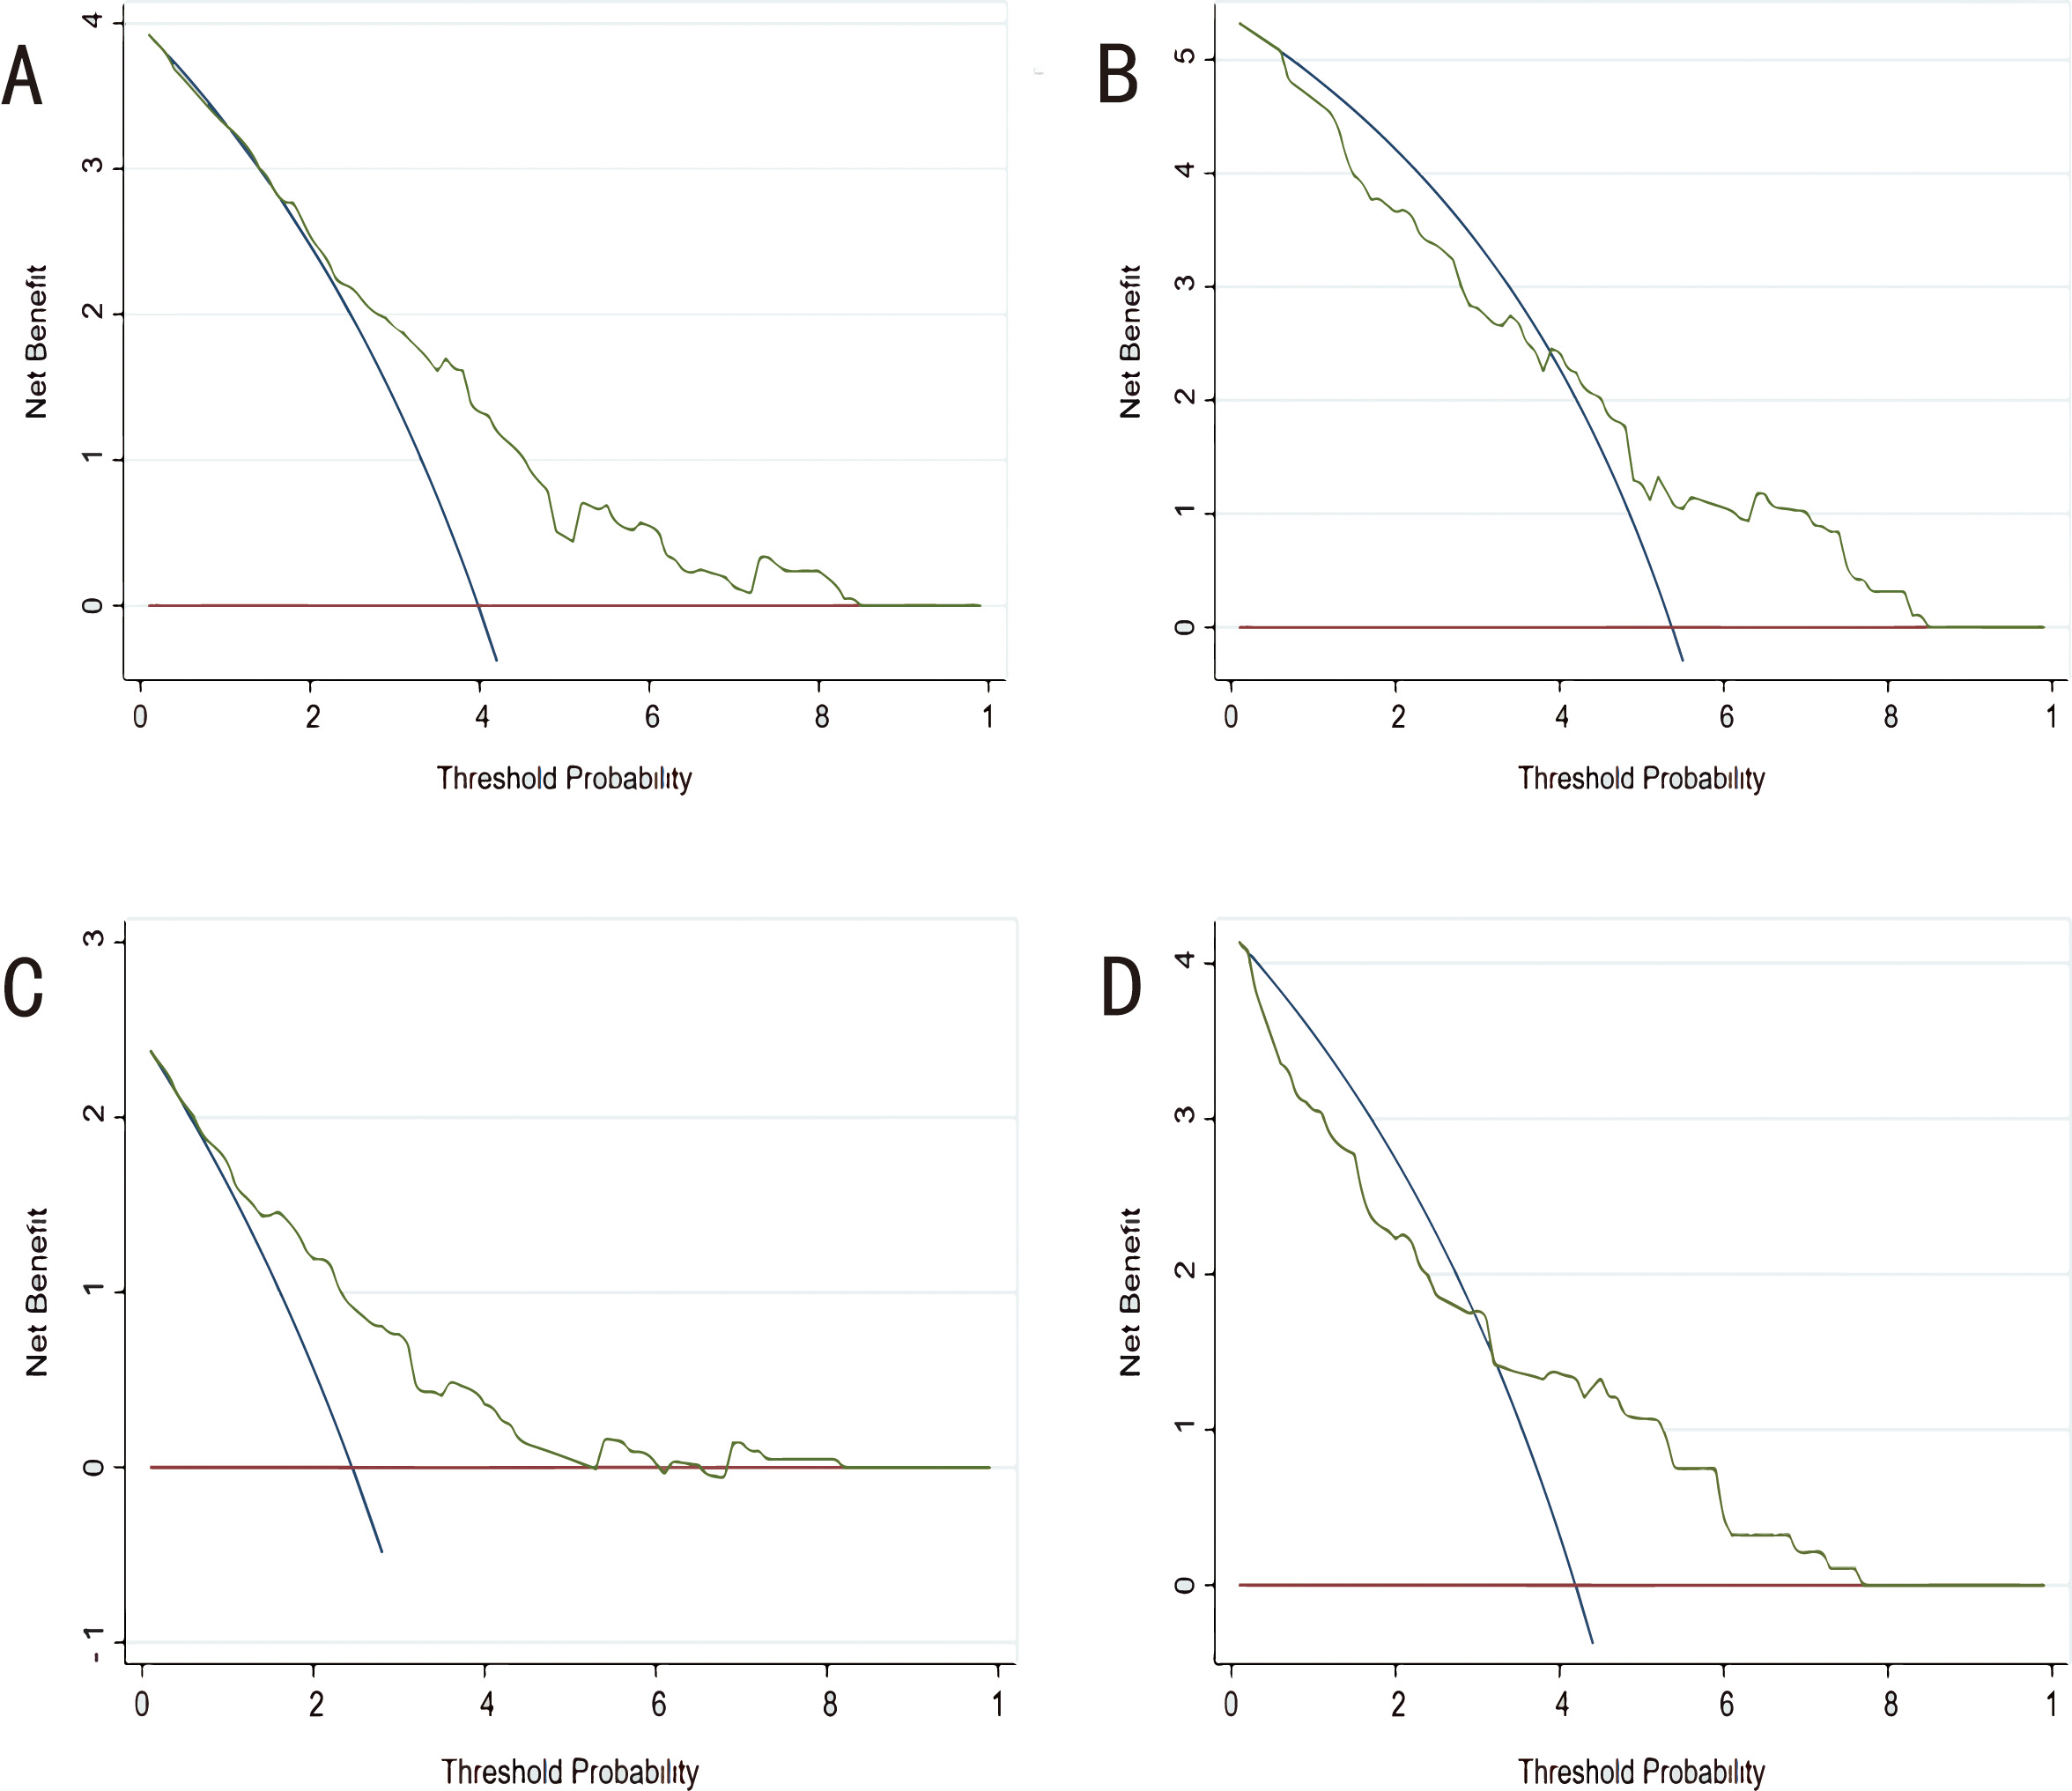 Fig. 6.
Decision curve analysis (DCA) for each model in the derivation and validation cohorts. (A) DCA of CHARIS I model in the derivation cohort. (B) DCA of CHARIS I model in the external validation cohort. (C) DCA of CHARIS Ⅱ model in the derivation cohort. (D) DCA of CHARIS II model for in the external validation cohort. CHARIS, COPD/CHF/CHD, HTN, Atrial arrhythmias/AF, RBBB/RAD, Inverted T wave and S1Q3T3/ Sinus tachycardia.
In the present study we found that the presence of the S1Q3T3 pattern, sinus tachycardia and RAD were associated with significantly heavier thrombotic load and were more frequent in patients with pulmonary trunk embolism than peripheral embolism. Furthermore, multivariate regression analysis revealed that sinus tachycardia was an independent predictor of thrombotic load (odds ratio (OR): 2.42; p = 0.016). In addition, we observed that RBBB, atrial arrhythmias and V1–V3 TWI showed trends for correlation with the Qanadli score or with the location of thrombus. There is mounting evidence to suggest these three ECG abnormalities are more frequent in cases with massive PTE than cases with sub-massive or no PTE, while still being valuable in the prognostic assessment of PTE [5, 6, 13, 14, 15, 16, 17, 18, 19, 20]. These paradoxical results may be due to our failure to screen out the new-onset RBBB, atrial arrhythmias and TWI in V1–V3, or because of the small sample size.
ECG changes in PTE essentially relates to dilatation of RV and alteration in the contractile properties of the RV myocardium induced by abrupt increase in pulmonary vascular resistance (PVR) [21]. Other pathophysiologic mechanisms that contribute to the ECG changes include PTE-induced release of inflammatory mediators, RV strain and hypoxia [22]. After reviewing 10 studies comprising 3007 patients with APTE, Shopp et al. [23] concluded that six findings of RV strain on 12-lead ECG (tachycardia, S1Q3T3, complete RBBB, TWI in V1–V4, ST elevation in aVR, and AF) were associated with an increased risk of circulatory shock and death.
Indeed, tachycardia is the only ECG abnormality included in both the original
and simplified versions of the pulmonary embolism severity index (PESI) score [24, 25]. According to Kucher
et al. [26], a heart rate
Rodrigues B, et al. [39] showed that a Qanadli score
To help distinguish patients with massive PTE from those with smaller PTE, we
developed the CHARIS I and CHARIS II algorithms to calculate the risk of a
Qanadli score
Currently, MCTPA is the preferred diagnostic modality for outpatients and emergency patients with suspected PTE. However, MCTPA is contraindicated for patients with history of severe contrast allergy, severe renal insufficiency, hyperthyroidism, or who are pregnant. Moreover, it is not available in remote areas and primary hospitals. 12-channel ECG is the most affordable, simple, secure, rapidly interpretable, repeatable and noninvasive test for the diagnosis and risk assessment of PTE. In summary, the present study used ECG signs and removed the impacts of several comorbidities on ECGs to develop two novel scoring systems that can help to estimate the clot burden of PTE and decisions regarding hospitalization.
Several limitations of our study should be addressed. Firstly, despite being a multicenter study, the sample size of the derivation and validation cohorts was relatively small, and validation with a larger patient cohort is needed. Secondly, other ECG findings that were not included in our models, such as ST-segment depression (STD) [4, 6, 8, 10, 14], ST Elevation [6, 8, 10, 14, 41, 42], low QRS voltage in the peripheral leads [4, 8], QRS Fragmentation [8] and long QT [43]. These ECG changes were reported to provide valuable prognostic information in acute PTE. Therefore, the use of our rules to assist with diagnosis may result in some patients with massive PE being missed. Additionally, the severity of PTE in our study was defined by the degree of obstruction or filling defect on MCTPA. However, this is not in accordance with the current definition of massive PTE, which is characterized by hemodynamic collapse. Further research is needed to evaluate the accuracy of our algorithms for predicting the risk of adverse outcomes in patients with APTE. Another weakness of the study was that our models were not compared to previous scoring systems such as the Daniel score. Finally, patients with incomplete data were excluded on account of retrospective design, which may have introduced some patient selection bias. Despite these limitations, the greatest strength of the present investigation was the incorporation of several comorbid diseases into the models, thus reducing the confounding bias introduced by these comorbidities on the ECGs.
Algorithms were developed based on ECG abnormalities for quantitative and localization evaluation of thrombus burden in patients with APTE and then validated in an external population. The CHARIS I and CHARIS II models showed moderate discrimination and good calibration, while also demonstrating positive net benefits by decision curve analysis. Taken together, the novel algorithms were shown to be useful tools that could assist physicians when screening patients with massive PTE prior to imaging diagnosis, as well as in making decisions regarding patient hospitalization.
The datasets used and analyzed during the current study are available from the corresponding author on reasonable request.
FW, LW, DCX and YWX designed the research study. FW, CXY, XXC, HPW and KYZ made contributions to the data acquisition. FW and DCX analyzed the data. All authors contributed to editorial changes in the manuscript. All authors read and approved the final manuscript. All authors have participated sufficiently in the work and agreed to be accountable for all aspects of the work.
All patients provided written informed consents, the study was approved by the competent ethics committee (SHSY-IEC-4.1/21-179/01) and complied with the Declaration of Helsinki and good clinical practice guidelines.
Not applicable.
This study was funded by Clinical Research Plan of Shanghai Hospital Development Center (No. SHDC2020CR3030B).
The authors declare no conflict of interest.
Publisher’s Note: IMR Press stays neutral with regard to jurisdictional claims in published maps and institutional affiliations.